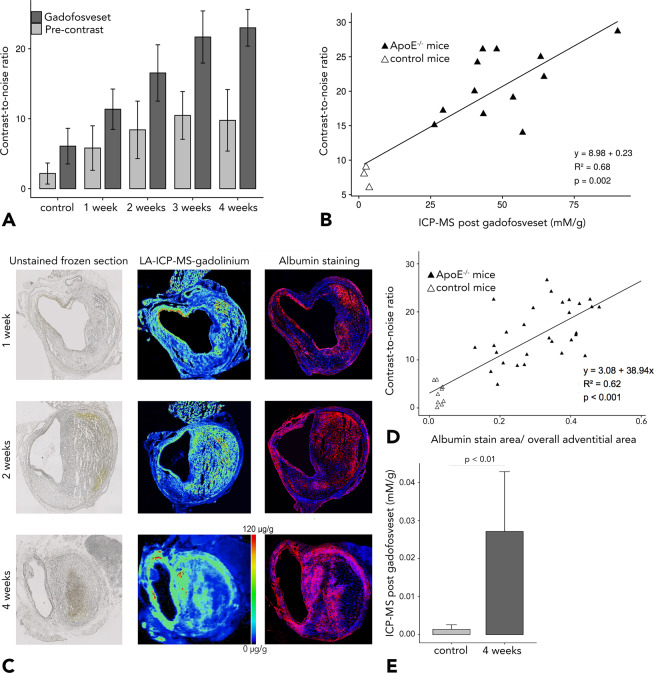
Figure 5.
Ex vivo quantification of in vivo MRI results. (A) Contrast-to-noise ratios measured in control animals and in ApoE−/− mice after 1, 2, 3 and 4 weeks of Angiotensin II infusion. Postcontrast (gadofosveset) contrast-to-noise ratios show increased signal enhancement with progression of abdominal aortic aneurysm (AAA) in ApoE−/− mice. (B) Shows a significant positive correlation between gadofosveset-enhanced contrast-to-noise ratios and gadofosveset-based gadolinium concentrations as determined by inductively coupled plasma mass spectrometry (ICP-MS) (Pearson’s correlation coefficient of R2 = 0.68). (C) Demonstrates the unstained frozen section (left), the spatial distribution of gadolinium (from the albumin-specific gadolinium-based probe) in aortic aneurysms as assessed by LA-ICP-MS (middle) and the co-localization of albumin-positive areas in the fluorescence albumin stain with gadolinium distribution (left). (D) Ex vivo relative fluorescence albumin-stained areas also demontrate significant correlation with in vivo measured contrast-to-noise ratios (R2 = 0.62). (E) Compared to sham-treated animals, Angiotensin II-infused ApoE−/− mice at 4 weeks show significantly higher gadolinium content as determined by ICP-MS. n = 9 per group for the MRI experiments. n = 3 per group for ICP-MS.

