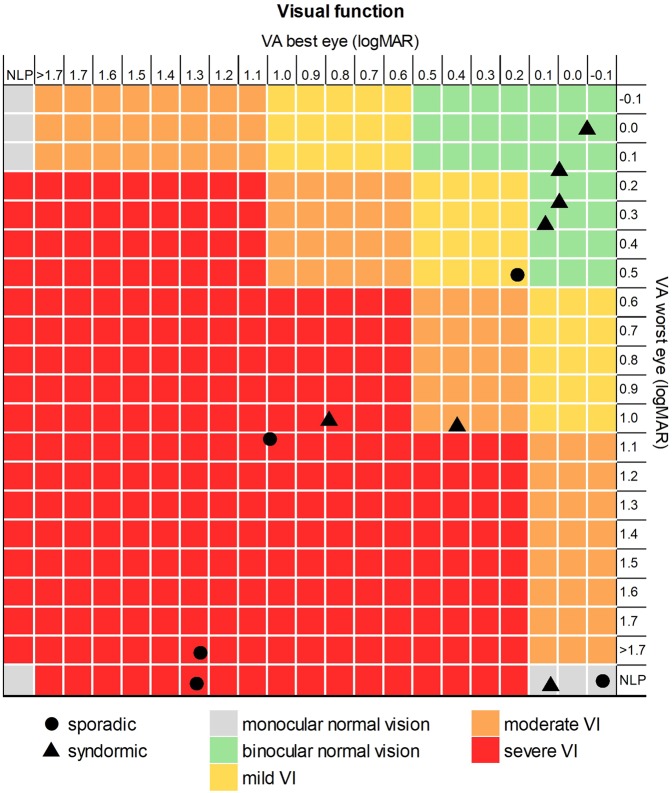
Figure 1.
Classification of the visual acuity scores of the best (x-axis) and worst (y-axis) eyes of each study participant, either with sporadic (circles) or syndromic (triangles) OPG. Children were grouped into five categories: binocular normal vision (green), monocular normal vision (grey), mild visual impairment (yellow), moderate visual impairment (orange) and severe visual impairment (red). VA = visual acuity; VI = visual impairment; NLP = no light perception.

