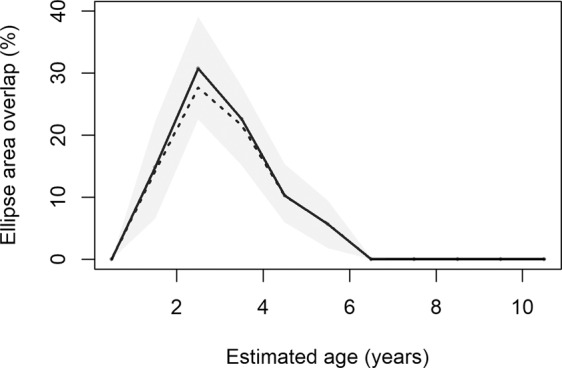
Figure 6.

Percentage overlap in Standard Ellipse Area (SEA) of male Antarctic fur seals as they age with female Group 1 (females with lower mean δ13C values than estimated δ13C value of whiskers at the Polar Front). Bold line shows overlap in SEA using maximum likelihood, dashed line shows mode overlap using Bayesian inference, and grey shaded region shows 95% credibility interval around this mode. Figure was created using R software (v3.6.1; https://www.R-project.org/).
