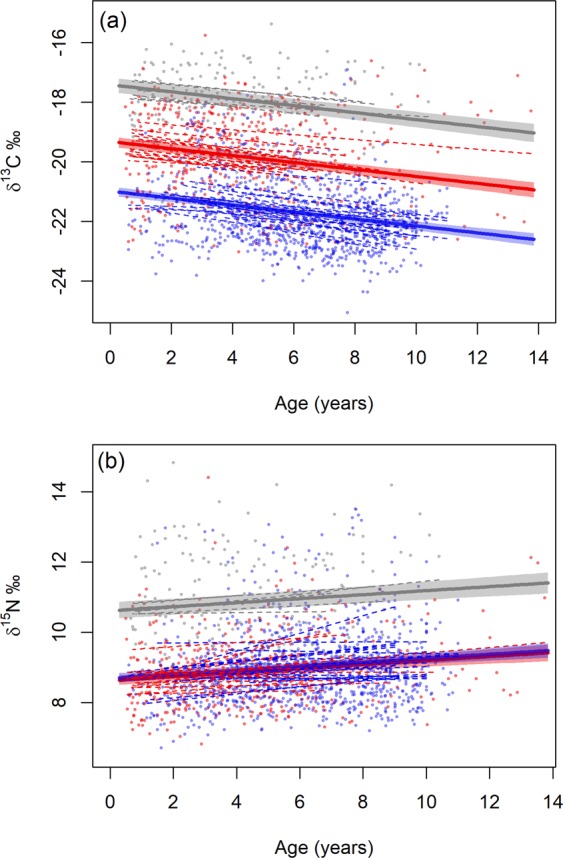
Figure 7.

Best-fit linear mixed models explaining the change in (a) δ13C and (b) δ15N values along Antarctic fur seal whiskers with estimated age of males (blue) and minimum estimated age of females: female Group 1 (red; females with lower mean δ13C values than estimated δ13C value at the Polar Front) and female Group 2 (grey; females with higher mean δ13C values than estimated δ13C value of whiskers at the Polar Front). Points are isotope values of each whisker sample, dashed lines are fitted slopes explaining trend for each individual seal, bold lines are fitted trends for each group and shaded areas indicate standard error. Figure was created using R software (v3.6.1; https://www.R-project.org/).
