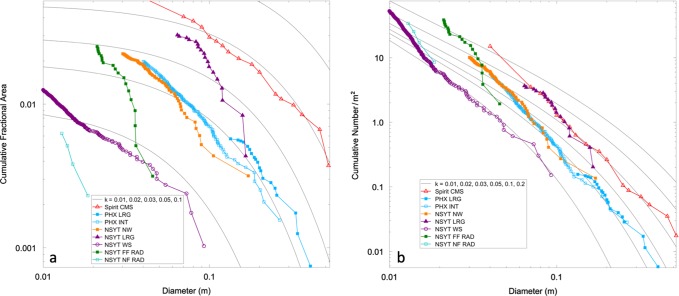
Fig. 10. Rock size-frequency distributions.
a Cumulative fractional area and b cumulative number per m2 versus diameter of rocks near the InSight lander as well as those measured at the Spirit (Spirit CMS for Columbia Memorial Station) and Phoenix (PHX) landing sites. Also shown are exponential model size-frequency distributions for rock abundances (k) of 1%, 2%, 3%, 5% and 10%30. Note curves in b are not exponentials and approach a straight line at small diameter (note that fractional area is dependent on the diameter squared, whereas cumulative number is not), but are matches to the exponential models based on cumulative fractional area in (a). Surface rock counts are: near and far RAD spots (NSYT NFF RAD and NSYT FF RAD, respectively), the workspace (NSYT WS), the area to the northwest (NSYT NW), and the area to the south with the largest rocks (NSYT LRG). Spirit CMS from Golombek et al.33, Phoenix intermediate area (PHX INT) from Heet et al.68 and Phoenix largest rocks (PHX LRG) from Golombek et al.32. Measurement uncertainty as stated earlier is between 1–4 mm, which would have no appreciable effect on the plots.

