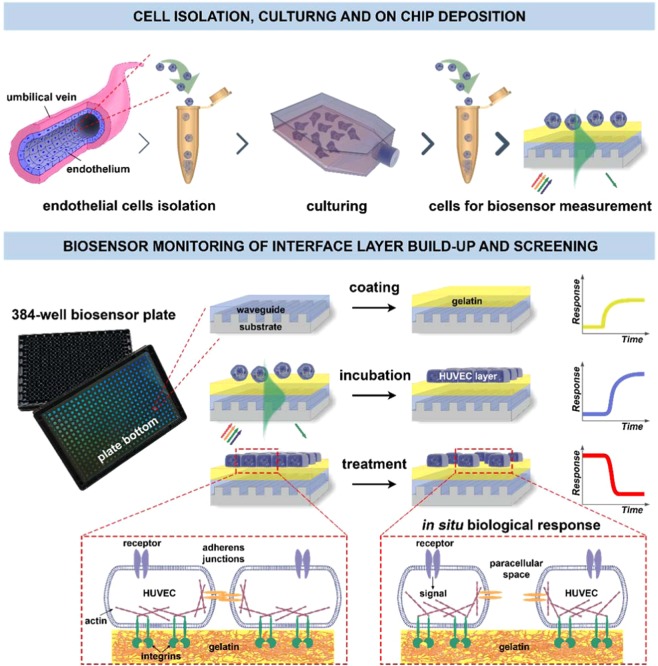
Figure 1.
Schematic overview of the proposed EnLaB measurement setup. Upper part: cell preparation steps (primary cell isolation, culturing, transferring onto the sensor chip surface). The incoupled waveguide mode intensity profile is shown in green color. The exponentially decaying evanescent field of the mode senses the adhering cells. The waveguide mode is excited by illuminating the grating structure from below using a broad range of wavelengths. The resonant wavelength excites the waveguide mode which – after propagating a short distance inside the waveguide – couples out into the direction of the substrate (shown in green). The lower part illustrates the steps of the biosensor measurements and typically obtained biosensor responses (the detected shifts in the resonant wavelength): coating of the chip with gelatin, following with cell attachment to the gelatin surface, and subsequent cell treatment by the studied molecular compounds (screening). Illustration of the biological effect of the treatment is highlighted in dashed boxes.

