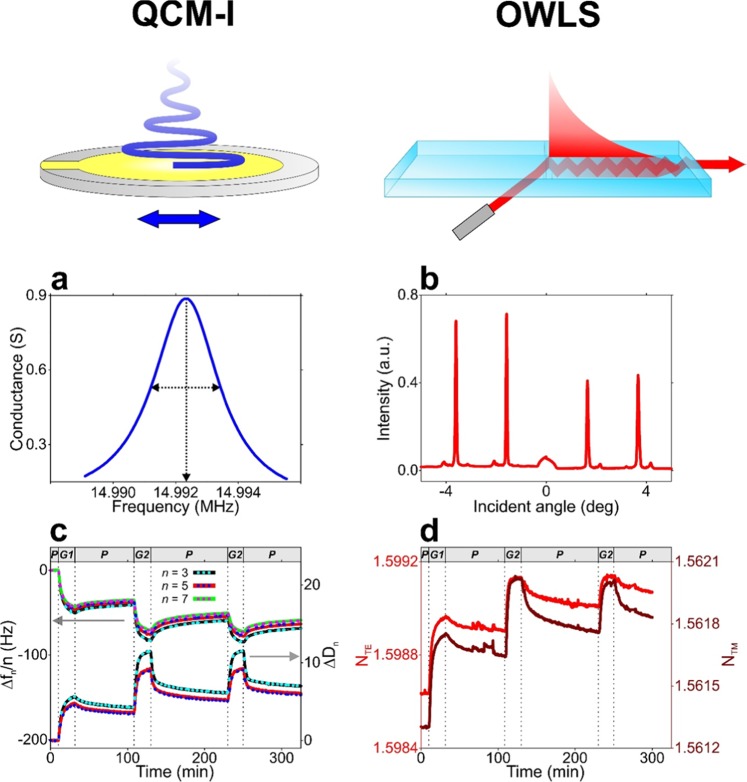
Figure 2.
Measurement principle of the QCM-I and OWLS biosensor techniques and obtained raw data from in situ measurements on gelatin layer formation. (a,b) Raw data obtained from QCM-I and OWLS the measurements: the resonance peak around the 3rd overtone resonance frequency (a QCM-I) as well as the intensity peaks of the excited modes at the coupling angles (b OWLS). In the case of QCM-I, the frequency and full width at half maximum (FWHM) value of the resonance peak are registered at each measurement time and the resulting normalized frequency shift (Δfn/n) and dissipation shift (ΔDn) data (the latter calculated from FWHM) at the selected n overtones are used for the model fit. (c) Gelatin deposition experiment monitored by in situ QCM-I. The measured Δfn/n and ΔDn data are represented by solid lines with different colors, while the data resulting from fitting the Voigt-based viscoelastic model are represented by colored dashed lines. The graph header and dashed vertical lines indicate the phases of the deposition experiment (P: PBS flow, G1: flow of 0.2 mg/ml gelatin solution, G2: flow of 2 mg/ml gelatin solution). (d) Effective refractive index data corresponding to the transverse electric (NTE, red line) and magnetic modes (NTM, brown line) obtained by parallel OWLS measurement on gelatin layer formation (the experiment was performed with the same phases detailed above for QCM-I).

