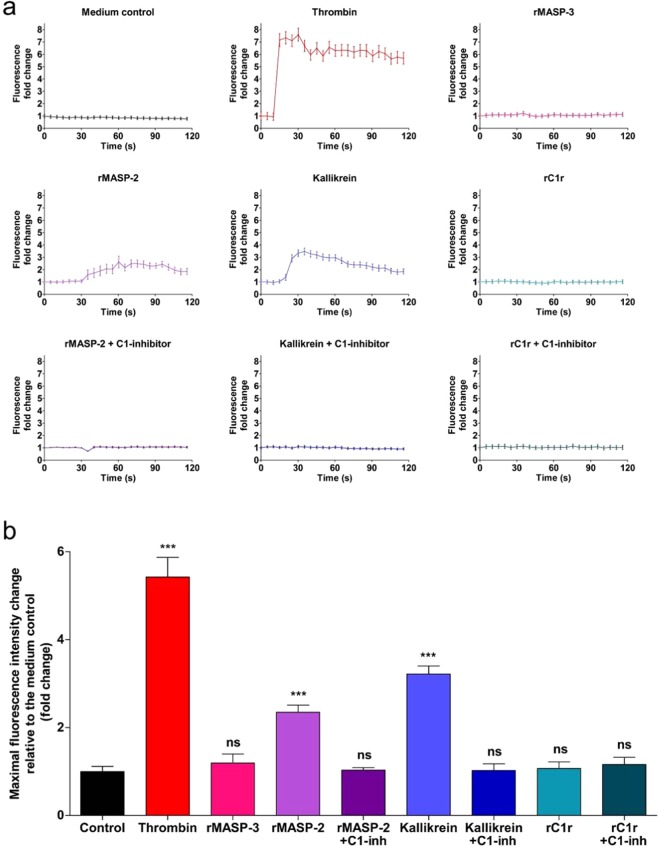
Figure 7.
Effects of plasma serine proteases on intracellular Ca2+ mobilization of HUVECs. Confluent layers of HUVECs were seeded onto 96 well microplates and cultured for 24 h. Cells were loaded with 2 μM Fluo-4-AM for 20 min, then incubated in HBSS for another 20 min. Sequential images were obtained every 5 s by fluorescence microscopy. Three photos were taken to determine the baseline fluorescence, then cells were treated with thrombin (300 nM), rMASP-3 (1 μM), rMASP-2 (2 μM), rMASP-2/C1-INH complex (2 μM/ 6 μM), kallikrein (2 μM), kallikrein/C1-INH complex (2 μM/ 6 μM), rC1r (1 μM), rC1r/C1-INH complex (1 μM/ 3 μM), or culture medium alone and the response was monitored for 2 min. Twenty cells per image were analyzed using the CellP software (Olympus). (a) Graphs from single, representative experiments. Fluorescence fold change values relative to medium control is shown, except in case of Medium control, where all kinetic values are normalized to the first fluorescence value. (b) Means of the maximum fluorescence intensity values of 3 independent experiments, normalized to the control.

