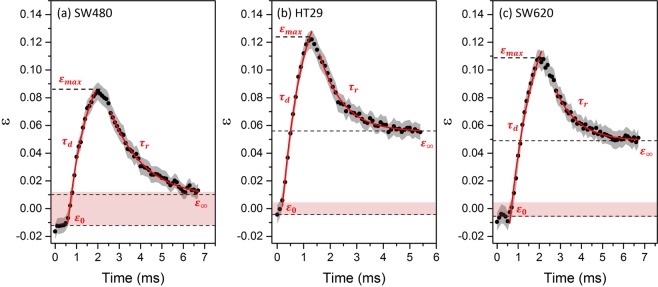
Figure 3.
Strain ε was tracked for the three CRC cell types as a function of time, with the standard error shown by the grey shaded areas. Q was fixed at 5 µl/min and the suspension medium viscosity was 33 cP. The final strain is marked by dashed lines , found by extrapolation of a exponential fit to the relaxation (red line). (a) The averaged deformation trace of N = 56 SW480 cells. (b) The averaged deformation trace of N = 49 HT29 cells. (c) The averaged deformation trace of N = 50 SW620 cells.

