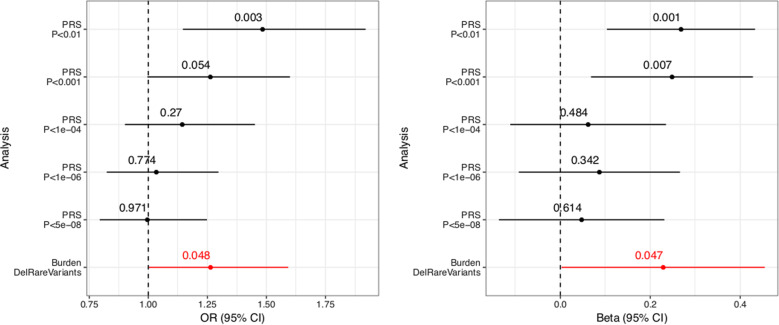
Fig. 2. Forest plot displaying the mean and confidence interval of regression coefficients of PRS analysis and rare variant burden analysis for SNVs.
We compared the quantile-normal transformed PRS estimated from PGC BP1 GWAS summary statistics between BP1 individuals and controls and also compared the burden of rare deleterious SNVs between BP1 individuals and controls in the 8,237 genes relevant to BP. PRS is computed at different GWAS p value thresholds of the PGC BP1 GWAS. The burden score was regressed on the burden of all rare variants in the 8,237 genes, and the residuals were quantile-normal transformed. The black lines indicate results of the PRS analysis while the red line indicates results of the rare variant burden analysis. The association between PRS and BP1 status and between the rare variant burden and BP1 status was assessed using a generalized linear mixed model (left) and a linear mixed model (right) that took into account relatedness.

