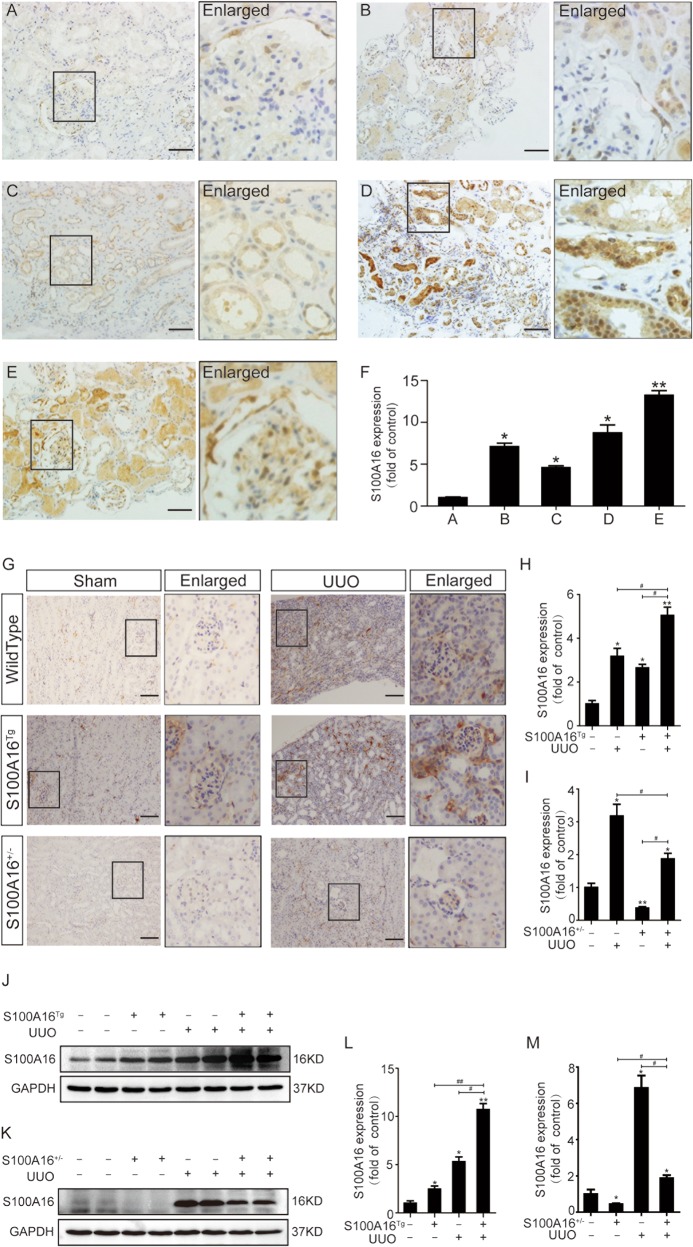
Fig. 1. Increased S100A16 expression in multiple types of clinical nephropathy and in a mouse UUO model.
a–e Immunohistochemical staining of S100A16 in kidney biopsy specimens from patients with kidney disease. Scale bar = 50 μm. f Semi-quantitative analysis of S100A16 protein expression levels. *p < 0.05, **p < 0.01 compared with normal human kidneys. g Representative images for immunohistochemical staining of S100A16 in the obstructed kidneys of wild type mice, S100A16Tg mice, and S100A16+/− mice. Scale bar = 50 μm. h, i Semi-quantitative analysis of S100A16 protein expression in S100A16Tg and S100A16+/− UUO kidneys compared with wild type sham groups. *p < 0.05, **p < 0.01 compared with wild type sham groups; #p < 0.05. j, k Representative bands of western blots showing S100A16 protein abundance in obstructed transgenic murine kidneys. l, m Semi-quantitative analysis of S100A16 protein expression levels. *p < 0.05, **p < 0.01 compared with a wild type sham groups; #p < 0.05, ##p < 0.01.

