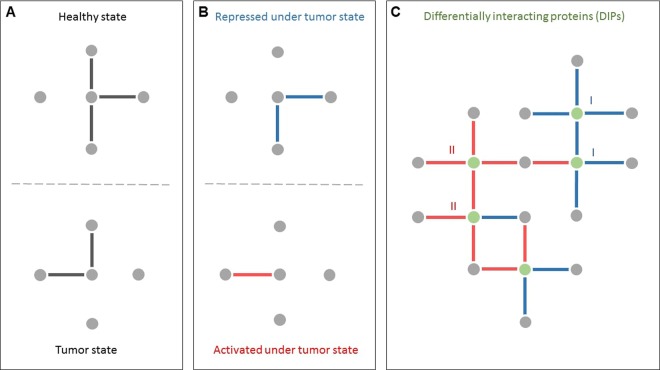
Figure 1.
Schematic overview of differential interactome analysis between two phenotypes. (A) Highly probable protein-protein interactions (PPIs) in each phenotype. (B) Comparative analysis of interactome profiles of the phenotypes leads to the identification of differential PPIs, which are categorized into two groups as repressed or activated under the phenotype of interest (e.g., diseased phenotype). (C) Differentially interacting proteins (DIPs) representing significant changes in their interaction patterns during the transition between the phenotypes.

