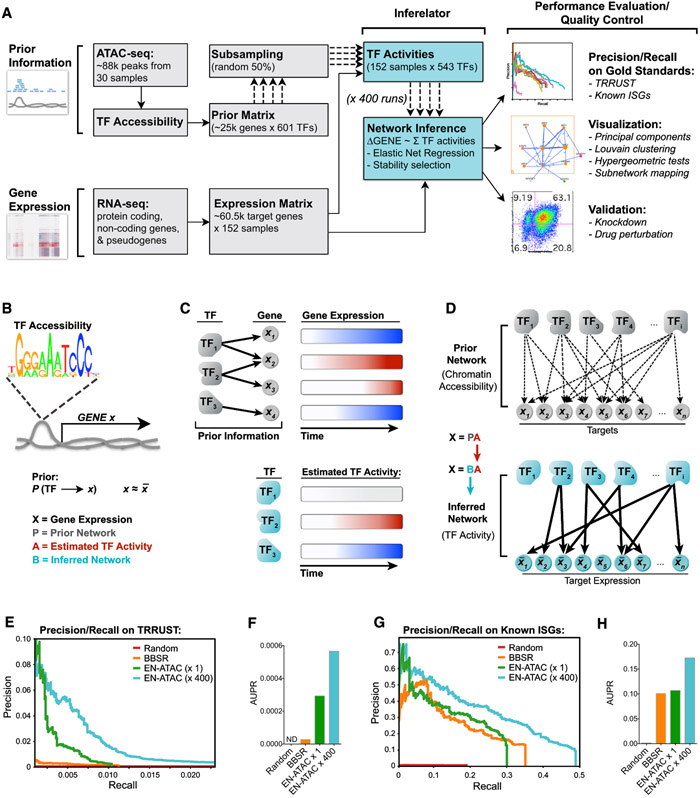
Figure 3. Repeated Subsampling of Prior Information Improves Network Inference.
(A) Pipeline for network inference. Prior information (TF accessibility) and gene expression time series data were used as inputs for the Inferelator. Output networks underwent performance evaluation and quality control as indicated.
(B) Prior matrix denotes a possible connection between TF and gene X if that TF’s binding motif is found in accessible chromatin upstream of (−1 kb) or within gene X.
(C) Schematic illustrating how TF activity is estimated by summing predicted target expression over time (red, increase; blue, decrease).
(D) TF and gene target connections in the Prior network are pruned using an EN regression to yield the final inferred network.
(E and F) Precision-recall plots (E) and area under precision-recall (AUPR) curves (F) for the indicated networks scored against the TRRUST database (see STAR Methods).
(G and H) Precision-recall plots (G) and AUPR curves (H) for the indicated networks scored against known ISGs (Schoggins et al., 2011).

