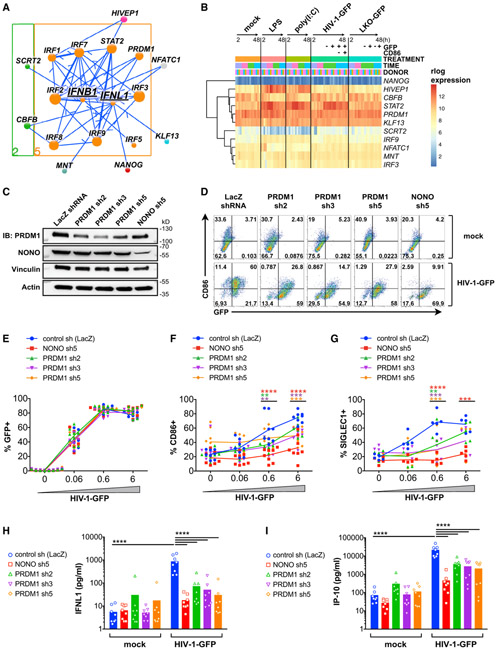
Figure 5. Subnetwork Exploration Uncovers Positive and Negative Regulators of IFN and ISGs.
(A) Jupyter widget subnetwork view (see STAR Methods) of predicted upstream regulators of IFNB1 and IFNL1. Arrows indicate transcriptional regulatory events between TFs and targets and do not specify positive or negative effects on target expression. Node size denotes the relative number of edges. Nodes are color coded by network cluster (see Figure 4).
(B) Heatmap of gene expression for the indicated TFs during treatment with LPS, poly(I:C), HIV-1-GFP (+Vpx), and LKO-GFP (+Vpx) at 2, 8, 24, and 48 h.
(C) Immunoblots of MDDC lysates after treatment with the indicated shRNAs.
(D) Flow cytometry of CD86 versus GFP expression in shRNA-modified MDDCs 48 h after mock treatment (+Vpx) or infection with HIV-1-GFP (+Vpx).
(E–G) Plots showing %GFP+ (E), %CD86+ (F), and %SIGLEC1+ (G) from MDDCs treated as in (D).
(H–I) ELISA of IFNL1 (H) and IP-10 (I) expression in supernatants from shRNA-modified MDDCs that were mock treated or infected with HIV-1-GFP for 48 h.
For (E)–(I), plots represent pooled data from 5–8 donors. **p < 0.01, ***p < 0.001, ****p < 0.0001.
See also Figure S5.

