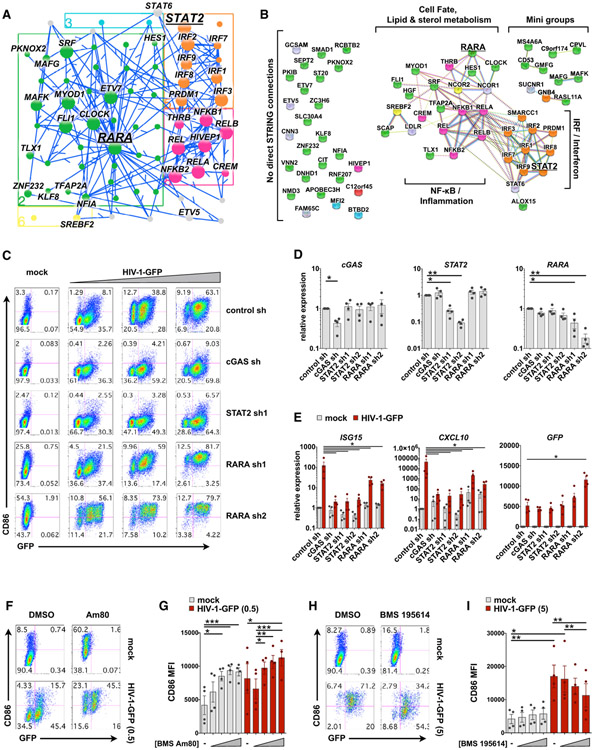
Figure 7. RARA Is a Negative Regulator of MDDC Maturation.
(A) Jupyter widget subnetwork view (see STAR Methods) showing edges between RARA, its predicted targets, STAT2, and the remaining top 30 TFs ranked by hypergeometric p value. Arrows point from TFs to targets but do not suggest positive or negative activity.
(B) STRING database connections for nodes shown in (A), including NCOR1 and NCOR2. Brackets indicate groups and biological pathways. Nodes connected in the EN-ATAC network with no direct STRING connections are shown to the left. In (A) and (B), nodes are color coded by network cluster.
(C) Flow cytometry plots of MDDCs modified by shRNA that were mock infected (+Vpx) or challenged with HIV-GFP (+Vpx) at day 4 for 48 h. Plots show CD86 versus GFP expression and represent 1 of 4 donors (MOI = 0.5, 1.5, and 5).
(D) qPCR validation of target knockdown in MDDCs modified by the indicated shRNAs.
(E) qPCR of ISG15, CXCL10, and GFP expression in shRNA-modified MDDCs that were either mock treated or infected with HIV-1-GFP (MOI = 5) for 24 h.
(F) Flow cytometry of MDDCs treated with vehicle or the RARA agonist Am80 (10 μM) ± infection with HIV-1-GFP for 48 h.
(G) Pooled data of CD86 MFI in MDDCs from 4 donors treated as in (F). Am80 concentrations = 10 nM, 100 nM, 1 μM, and 10 μM.
(H) Flow cytometry of MDDCs treated with vehicle or the RARA antagonist BMS 195614 (10 μM) ± infection with HIV-1-GFP for 48 h.
(I) Pooled data of CD86 MFI in MDDCs from 4 donors treated as in (H). BMS 195614 concentrations = 1 nM, 100 nM, and 10 μM.
For (D), (E), (G), and (I), n = 4 donors. *p < 0.05, **p < 0.01, ***p < 0.001. Data represent mean ± SEM. See also Figure S7.

