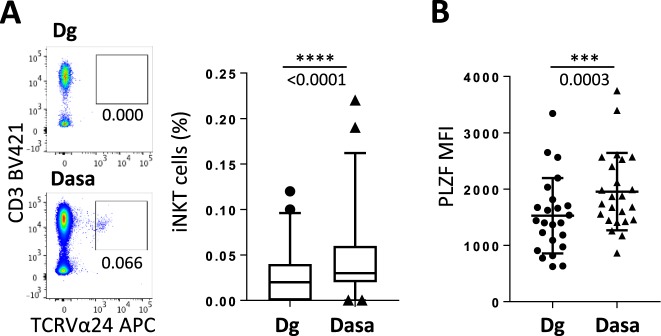
Figure 2.
iNKT-cell frequency increases in CML patients under dasatinib treatment PBMCs isolated from patients (n = 47) at CML diagnosis (Dg) or after 3 months of dasatinib treatment (Dasa) were analyzed by flow cytometry for iNKT cells frequency (A) (box plot representation: median, quartiles, bars: 5 and 95 percentiles) and PLZF MFI in iNKT cells (n = 24) (B). Representative plots are shown. Statistical analysis: paired two-tailed Wilcoxon test.

