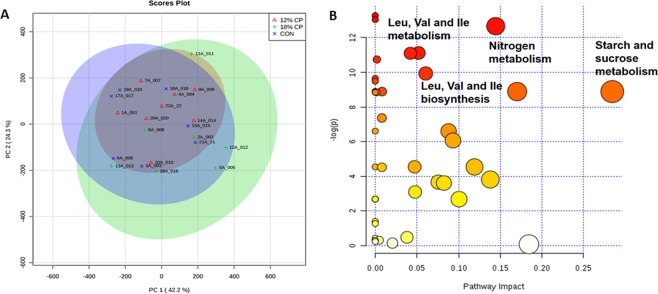
Figure 2.
Principle component analysis (PCA) score plots and the pathway analysis map of serum metabolites in piglets fed with low protein diets. (A) PCA score plots of serum metabolites. Each node represents an individual pig. (B) The map of pathway analysis for the metabolites detected in the blood serum. Each circle represents a metabolic pathway with the scores obtained from topology analysis (pathway impact; the x-axis) and the pathway enrichment analysis (y-axis). The color of each circle is based on its p-value, while the size of each circle is based on its impact values. Therefore, larger size circles are indicative of higher pathway impact, while darker colors circles are suggestive of more significant changes of metabolites and higher pathway enrichment. No difference in pathway enrichment was found between CON and 18% crude protein (CP) or between 18% CP and 12% CP. Therefore, the data for both CON and 18% CP were combined and compared with 12% CP for pathway enrichment. CON, control diet with 24% CP; 18% CP, low protein diet with 18% CP; 12% CP, low protein diet with 12% CP. n = 7, n = 7, n = 8 for CON, 18% CP and 12% CP groups, respectively.

