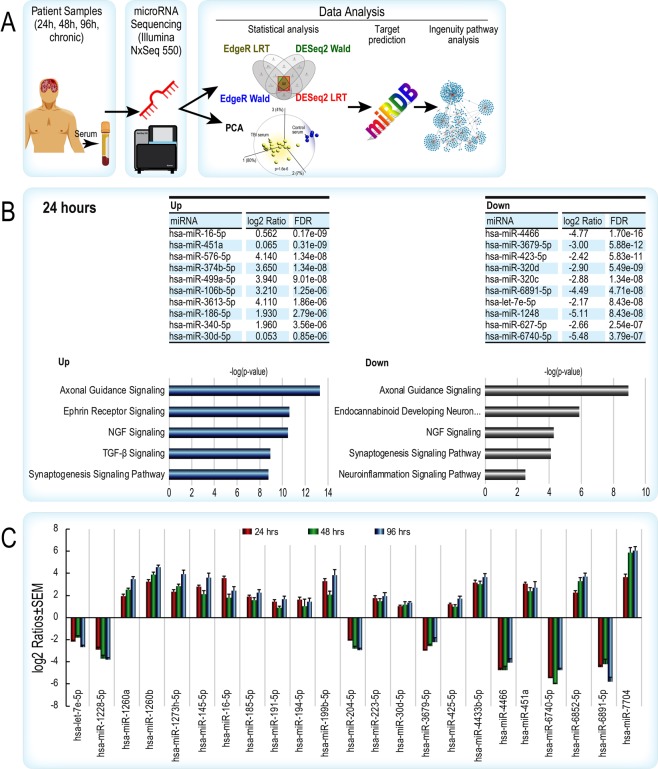
Figure 2.
(A) Experimental workflow for miRNA-seq and bioinformatic analysis of human uninjured control and TBI patient samples. (B) The top 10 up- and down-regulated miRNAs by level of significance (FDR adjusted p-value) in the 24 hr patient cohort. Ingenuity Pathway Analysis of predicted gene targets show the top nervous system-related canonical pathways for the up and down miRNAs, respectively are involved in synaptic plasticity, neurorestorative signaling and neuroinflammation. The x-axes are based on the -log of the Fisher’s Exact p-value. (C) Consistent expression of miRNAs across three acute periods after TBI. Data is displayed graphically as the log2 ratio ± SEM (y-axis) and significant miRNAs from the LRT and Wald tests in EdgeR and DESeq2 (x-axis). Red bars indicate 24 hrs, green 48 hrs, and blue 96 hrs after TBI. SEM – standard error of the mean; LRT – likelihood ratio test; hsa – human miRNA. Data were analyzed through the use of IPA (QIAGEN Inc., https://www.qiagenbioinformatics.com/products/ingenuitypathway-analysis).

