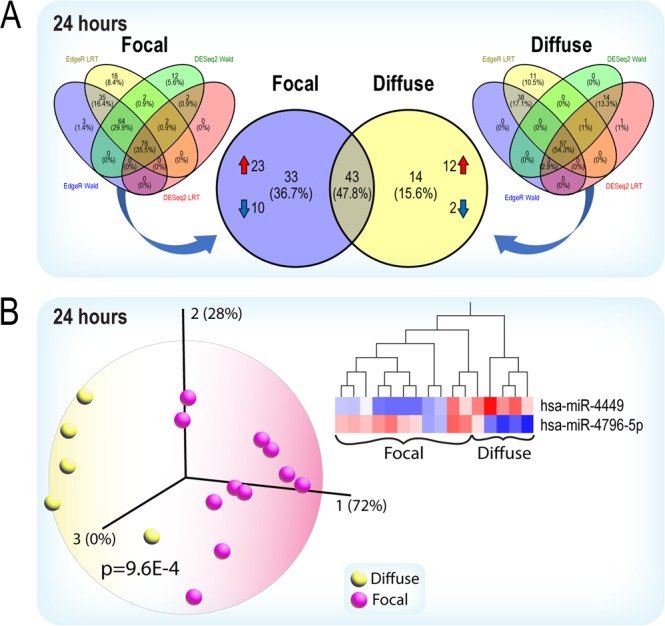
Figure 3.

(A) Patients in the 24 h cohort were separated based on injury designation, into either focal or diffuse injury categories. Overlapping significant miRNAs from the LRT and Wald tests in EdgeR and DESeq2 (compared to healthy controls) in each respective group are shown in the left and right Venn diagrams. Thirty-three miRNAs (23 up and 10 down) are unique to the focal injury group (purple circle, center Venn diagram). Fourteen (12 up and 2 down) are unique to the diffusely injured group (yellow circle, center Venn diagram). (B) Principal component analysis and the hierarchical clustering heatmap shows that two miRNAs discriminate the focal from the diffuse injury groups. The first two principal components represent 100% of the variance in the miRNA-seq data. Data were analyzed through the use of IPA (QIAGEN Inc., https://www.qiagenbioinformatics.com/products/ingenuitypathway-analysis) and Qlucore Omics Explorer.
