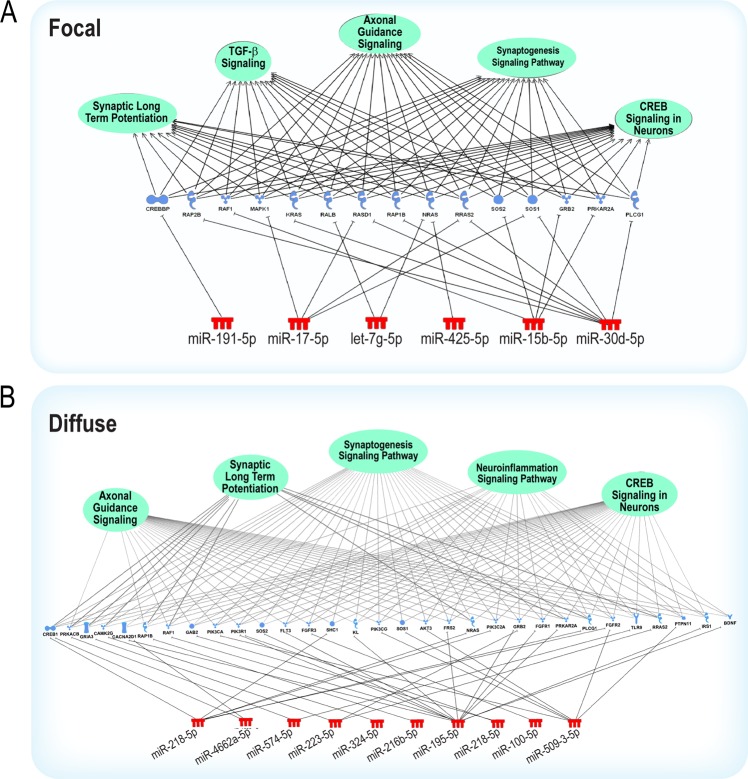
Figure 4.
Pathway analysis reveals predicted gene targets enriched in predominately nervous system signaling pathways for focal (A) or diffuse (B) injury cohorts. miRNA colors signify increased (red) expression compared to control samples. The color of the gene targets represents the predicted direction of regulation based on target-prediction using miRDB. The green circles represent biological pathways comprising of predicted genes based on Ingenuity Pathway Analysis. Data were analyzed through the use of IPA (QIAGEN Inc., https://www.qiagenbioinformatics.com/products/ingenuitypathway-analysis).

