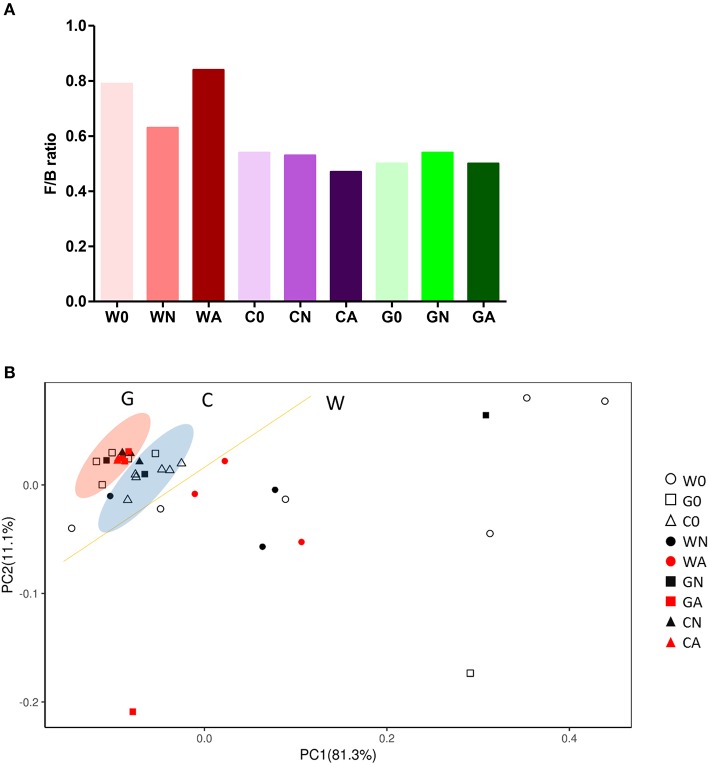
Figure 5.
Gut microbiota change in groups of offspring with or without HDM-sensitization and challenge. (A) The ratio of Firmicutes to Bacteroidetes (F/B ratio) in gut microbiota (B) Bi-plot representing the weighted Principal Coordinates Analysis (PCoA), pair-wise UniFrac distances showing clustering of bacterial groups from stool samples in groups of offspring.

