Figure 3.
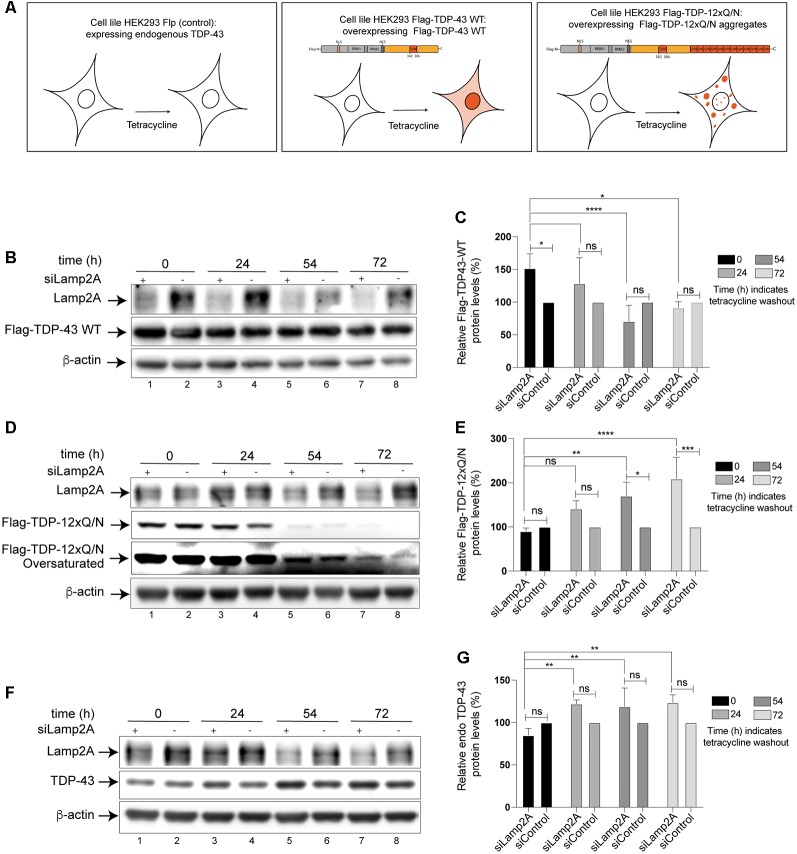
Protein levels of wild type and aggregated-prone forms of TDP-43 increase after inhibition of CMA. (A) Schematic representation of the three Human embryo kidney cell line 293 (HEK293) cell lines used in this study. HEK293 Flp-in (expressing endogenous TDP-43), HEK293 Flag-TDP-43 WT (overexpress a Flag- wild type form of TDP-43 after tetracycline induction), HEK293 Flag-TDP-12xQ/N (overexpress a Flag- aggregate-prone form of TDP-43 after tetracycline induction; Budini et al., 2015). (B) Lamp2A down-regulation was carried out in HEK293 Flag-TDP-43 WT cell line by transfecting an interfering RNA against human Lamp2A (siLamp2A). The expression of Flag-TDP-43 WT was induced for 48 h and then tetracycline was removed. The remaining levels of Flag-TDP-43 WT were evaluated by Western blot at indicated time points. An unrelated siRNA was used as control (see “Materials and Methods” section). Forty-eight hours post siRNA transfection, the expression of Flag-TDP-43 WT was evaluated at by Western blot at indicated time points. (C) Densitometric quantification of Flag-TDP-43 WT from (B). (D) Lamp2A siRNA was transfected in HEK293 Flag-TDP-12xQ/N cell line as indicated in (B). The expression of Flag-TDP-12xQ/N was induced for 48 h and then tetracycline was removed. The remaining levels of Flag-TDP-12xQ/N were evaluated by Western blot at indicated time points. (E) Densitometric quantification of Flag-TDP-12xQ/N from (D). (F) Lamp2A siRNA was transfected in HEK293 Flp-in as indicated in (B) and the protein levels of endogenous TDP-43 were evaluated by Western blot at indicated time points. (G) Densitometric quantification of endogenous TDP-43 from (F). Quantifications showed in (C,E,G) were calculated as follow: every time point was normalized against its own β-actin loading control. Upon normalization, every siLamp2A point was compared with the corresponding si-Control point (considered as 100%). Finally, every siLamp2A/siControl time point was compared with point zero (0) and between them. Numerical results are reported as mean ± SE. Differences among means were analyzed from three independent experiments using two-way ANOVA, followed by the Bonferroni post hoc test to determine statistical significance (p < 0.05). ns: no significant, *p < 0.05, **p < 0.01, ***p < 0.001, ****p < 0.0001.

