Figure 6.
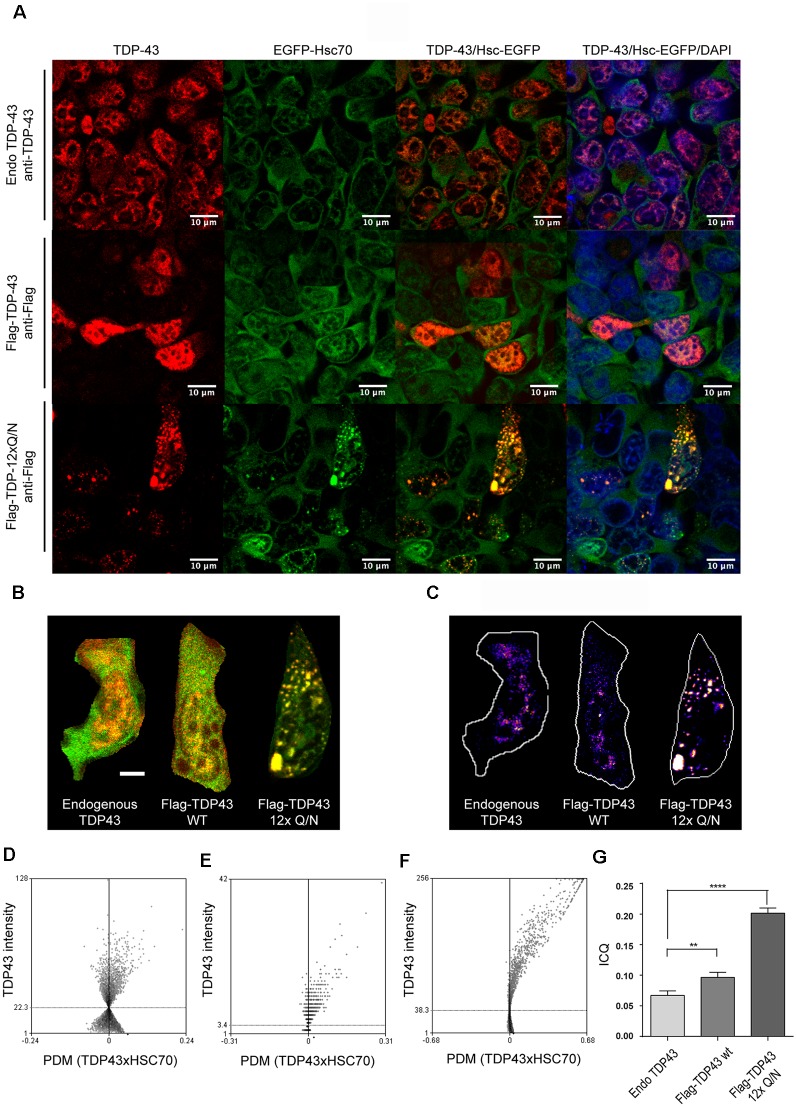
Aggregated-prone form of TDP-43 co-localizes with Hsc70. (A) HEK293 stably transfected with a plasmid expressing the EGFP-Hsc70 fusion protein were incubated with tetracycline for 24 h to allow the overexpression of the EGFP-Hsc70 protein. After tetracycline stimulation, the cell line was transiently transfected for 48 h with plasmids expressing Flag-TDP-43 WT, Flag-TDP-12xQ/N or the corresponding empty plasmid (pcDNA5 FRT/TO). Next, an immunofluorescence assay was performed to evaluate the co-localization of EGFP-Hsc70 with endogenous TDP-43 or the flagged proteins (Flag-TDP-43 WT and Flag-TDP-12xQ/N). Used antibodies were the following: anti-TDP-43 antibody (red, upper panels) an anti-Flag antibody (red, middle and lower panels). (B) Merged images used to calculate the spatial distribution of representative co-localizing pixels shown in (C) according to intensity correlation analysis (ICA) method. Positive PDM values (product of the differences from the mean) from the ICA and image pairs (scale bar = 5 μm) were calculated (D–F). Representative ICA graphs obtained for the ICA of endogenous TDP43 and EGFP-HSC70 (E), Flag-TDP43-WT and EGFP-HSC70 and TDP43 12xQ/N and HSC70-GFP. (G) Bars indicate mean intensity correlation quotients (ICQs) obtained from the analysis of pairs of immunofluorescence images for endogenous TDP-43 and EGFP-HSC70, Flag-TDP43-WT and EGFP-HSC70, and TDP43 12xQ/N and EGFP-HSC70. For all samples n ≥ 100. Ordinary one-way ANOVA was used (p < 0.05). **p < 0.01, ****p < 0.0001.

