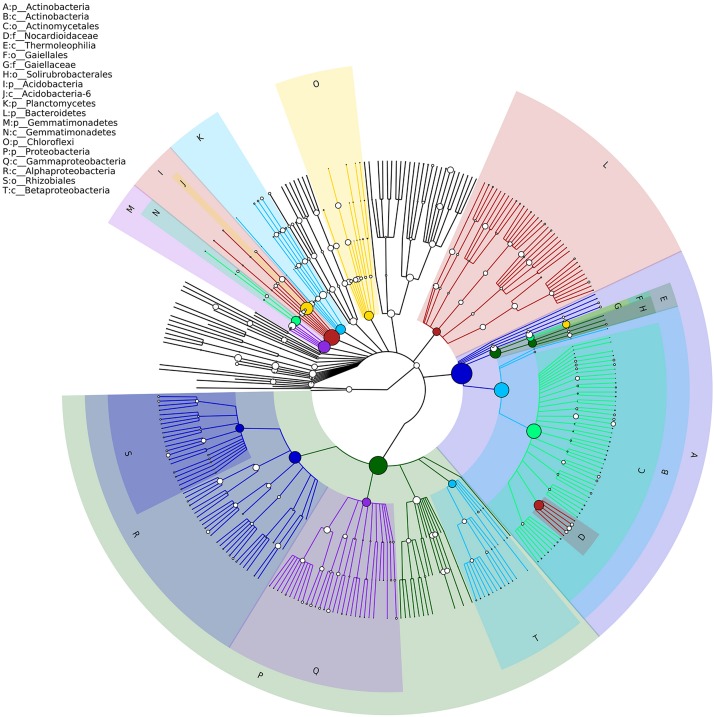
FIGURE 2.
Hierarchy tree graph of samples based on GraPhlAn. The node size corresponds to the average relative abundance of the taxon in all soil samples. The top-ranked 20 most abundant taxa were identified by the alphabet (the shadow color of alphabet corresponds to the nodes color of taxon) and were shown on the upper left. Seven phyla had relative abundance >2%, and almost 97% of soil bacterial sequences were attributed to these seven phyla.

