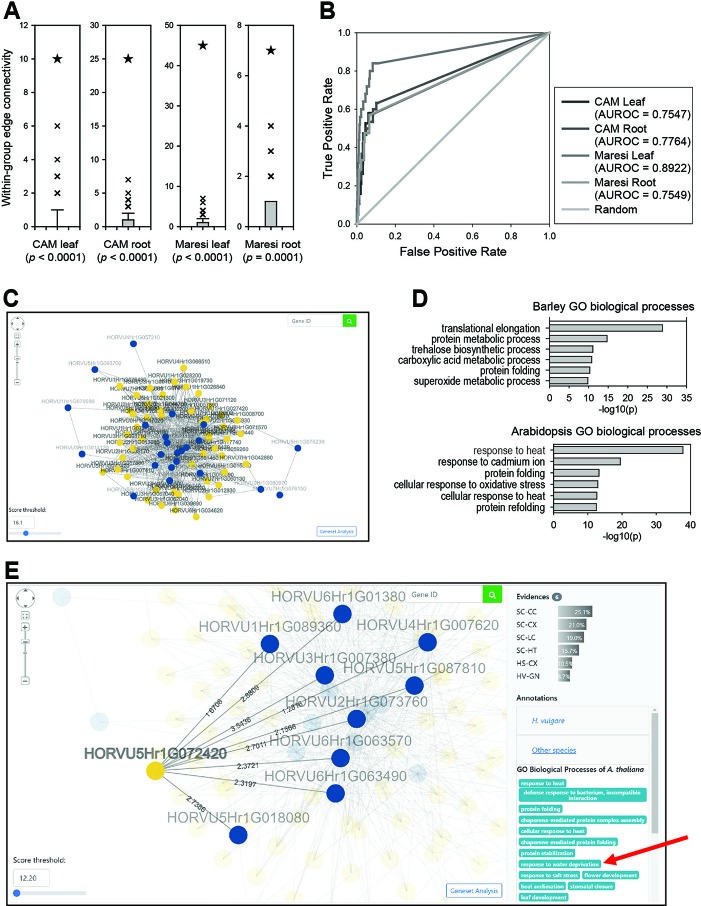
Figure 3.
Predictions for drought response genes using BarleyNet. (A) Within-group edge connectivity was computed for drought response genes identified from leaves and roots of two cultivars, Maresi and Cam/B1/CI (referred to as CAM), and 1,000 random gene sets of the same size. Asterisks indicate the within-group edge count of each trait-associated gene set in BarleyNet. Within-group edge counts for drought response genes by BarleyNet were significantly higher than those by random gene sets (P < 0.001 by a binomial test). (B) AUROC analysis for the same drought response genes. (C) Screenshot of network viewer, which visualizes a network of drought response genes identified from differentially accumulated proteins in CAM roots (guide genes; blue nodes) and their 50 closest neighbors (candidate genes; yellow nodes) in BarleyNet. The number of neighbors in the network can be controlled by selecting a score threshold at the bottom left area. Clicking the button at the right bottom area allows gene set enrichment analysis for the selected neighbors. (D) Enriched GOBP terms among the 50 closest neighbors to the drought response genes, based on barley (upper plot) and Arabidopsis GOBP annotations (lower plot). (E) Screenshot of the network viewer highlighting a selected candidate gene (yellow node), HORVU5Hr1G072420. The viewer also highlights its connected user-input guide genes (i.e., drought response genes; blue nodes) and edges with their log likelihood scores. The right-side panel shows related information such as data sources that support the prediction of HORVU5Hr1G072420 as a candidate gene (Evidences) with relative contributions (% of total prediction score), as well as GOBP annotations for the candidate gene. Notably, the selected candidate gene HORVU5Hr1G072420 was annotated for “response to water deprivation” in Arabidopsis GOBP annotations (marked by a red arrow).

