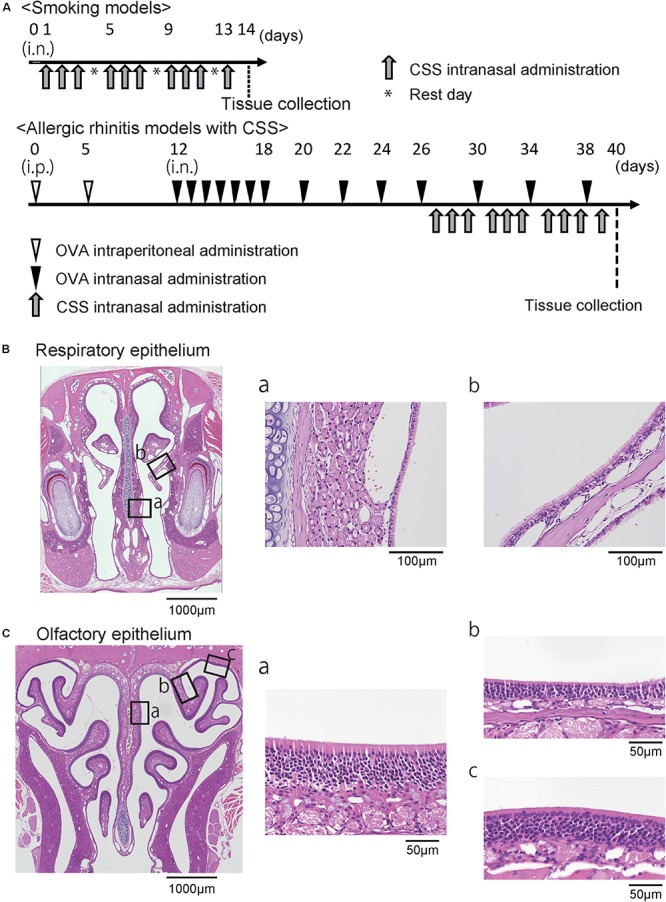
FIGURE 1.

(A) Experimental timeline. (B) Representative images of hematoxylin and eosin stained sections of the respiratory epithelium from control mice (40× magnification). The boxes in (B) indicate the region of the respiratory epithelium shown at higher magnification (400× magnification) in (B-a,b). (C) Representative images of the olfactory epithelium. The boxes in (C) indicate the region of the olfactory epithelium shown at higher magnification in (C-a,b,c). OVA, ovalbumin; CSS, cigarette smoke solution; i.p., intraperitoneal.
