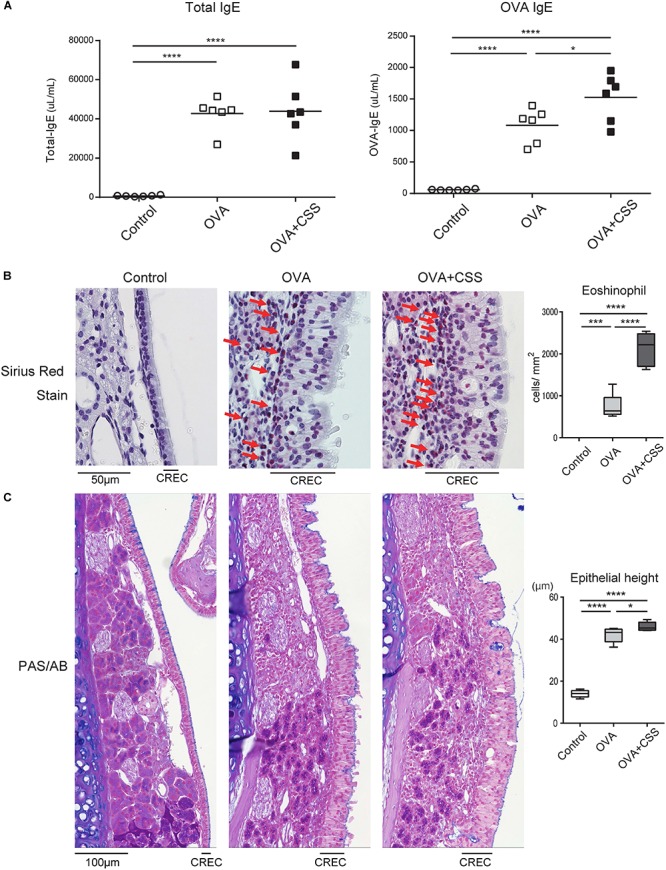
FIGURE 3.

(A) Serum immunoglobin E (IgE) levels in the control, ovalbumin-induced allergic (OVA), and OVA-allergic-smoking [OVA + cigarette smoke solution (CSS)] groups were determined by enzyme linked immunosorbent assay. (B) Representative images of Sirius red staining for eosinophils in the nasal respiratory mucosa (RM) (red arrows) (400× magnification), and a comparative chart of the eosinophil counts in each group. (C) Representative images of periodic acid-Schiff and Alcian blue (PAS/AB) staining in the nasal RM (400× magnification), and a comparative chart of the height of the columnar respiratory epithelial cells (CRECs). The height of CRECs in the OVA-immunized group was higher than that in the control group, and that in the OVA + CSS group was highest among the groups. *P < 0.05; ***P < 0.001; ****P < 0.0001 (n = 6, one-way analysis of variance).
