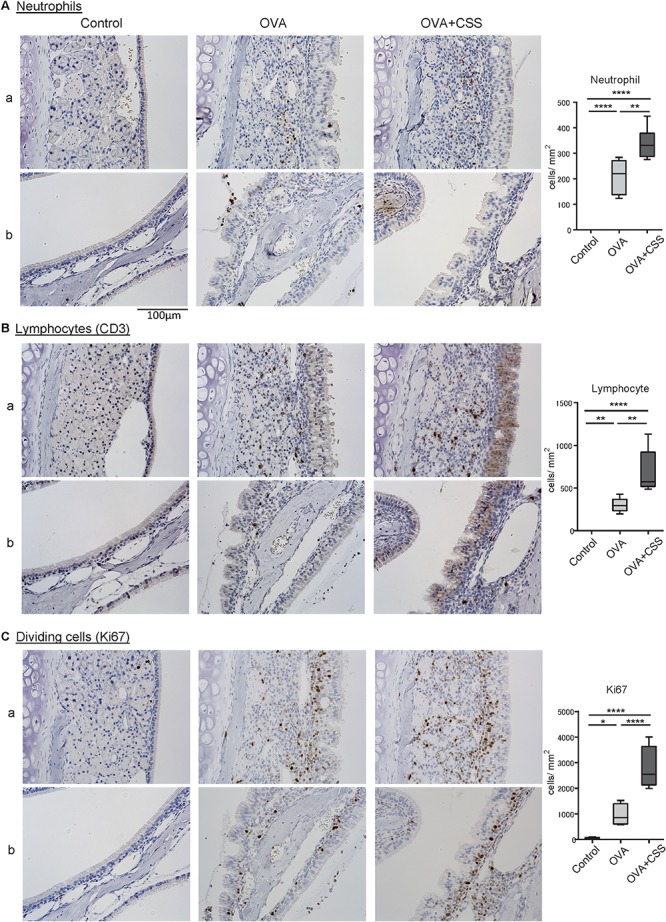
FIGURE 4.

(A–C) Inflammatory cell infiltration and cell division in the nasal RM were evaluated using immunohistochemical staining (brown). Tissue sections were counterstained with the nuclear dye hematoxylin (blue). Representative immunohistochemical images of neutrophils (A), CD3+ lymphocytes (B), and Ki67+ dividing cells (C) (400× magnification), and comparative charts of cell counts in each group. *P < 0.01; **P < 0.01; ****P < 0.0001 (n = 6, one-way analysis of variance). OVA, ovalbumin; CSS, cigarette smoke solution.
