
Fig. 4.
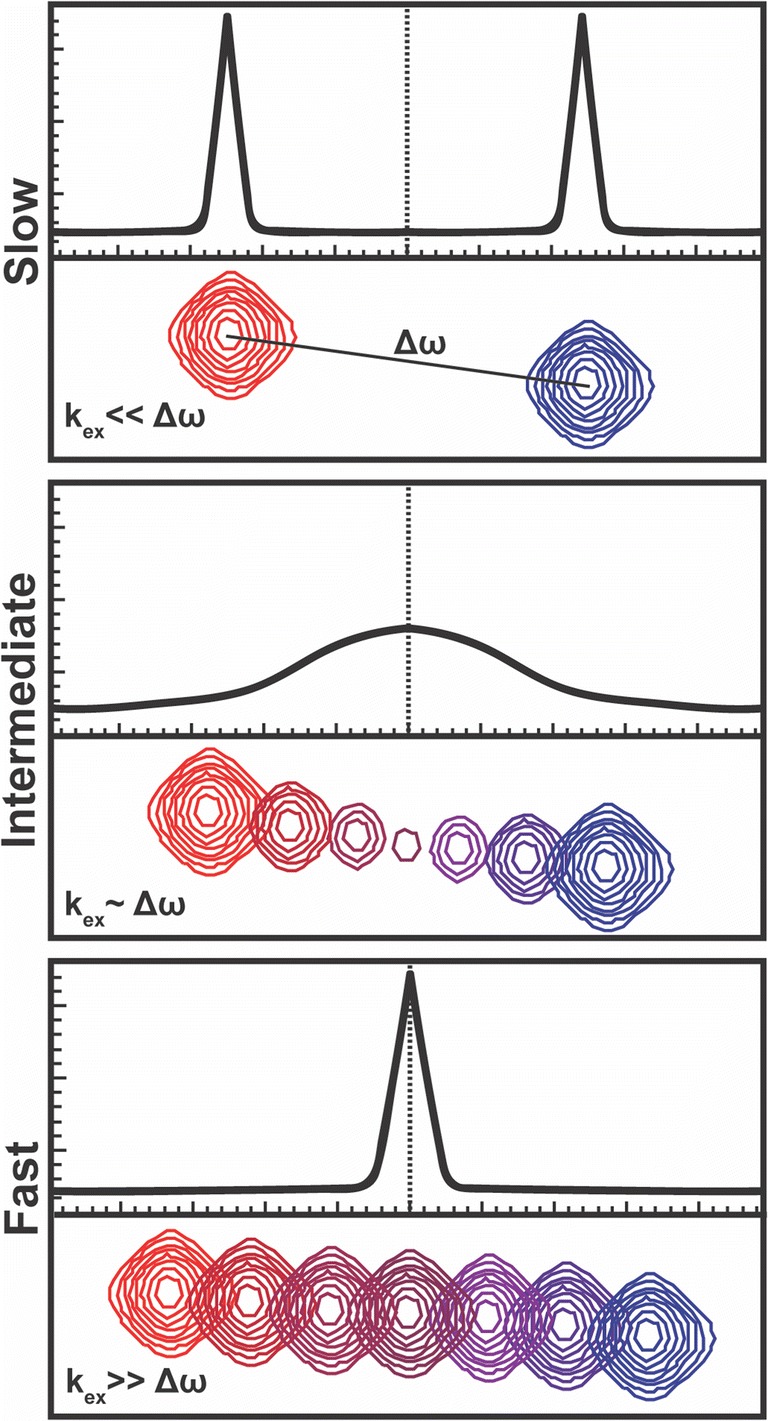
Exchange regimes dictate NMR chemical shift behavior based on the relationship between kex and Δω. For three distinguishable time regimes: slow (top), intermediate (middle), and fast (bottom), the 1D projection of a 1:1 mixture is shown for a 2D titration series. Analysis of the NMR lineshapes provide information about kex and Δω