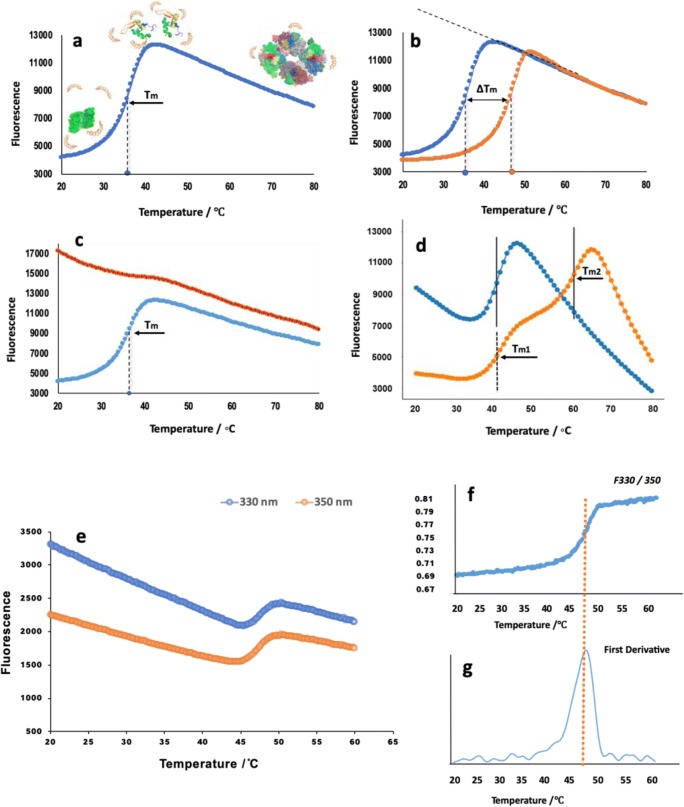
Fig. 1.
a Typical thermal denaturation profile of a protein sample. Fluorescence emission changes with the temperature. The sigmoidal curve indicates the cooperative unfolding status of the protein from trace amounts of SYPRO Orange (yellow) bound to the native protein (green). The peak indicates that all proteins are unfolded to linear peptides or that the hydrophobic core is exposed to SYPRO Orange. Multiple mechanisms exist for the reduction in fluorescence after the peak, including temperature-driven decrease in the binding constant of the dye (so less dye is bound to the protein), the pocket binding the dye being more mobile (allowing for more quenching by solvent); the dye itself is more mobile such that the degree of planarity required for electron conjugation/aromatic character is lessened and protein aggregation and dye dissociation through the exclusion of the dye from hydrophobic cores. The midpoint of the transition curve is the melting temperature (Tm). b DSF curve showing the unfolding status of a target protein in the absence (blue) and presence (orange) of a ligand. The difference in the melting temperature indicated as ΔTm. c Sample with high background fluorescence at the beginning at lower temperature (red) compared with a typical well-folded sample (blue) in the DSF assay. Improperly folded, aggregated, denatured protein or hydrophobic area such as a lipid bilayer exposed to the dye will cause high background at low temperatures. d Multiple transitions appearing during the heating process can be caused by different domains, aggregation increasing with temperature, or ligands that stabilize a portion of the protein sample (orange); typically one Tm similar to the native protein is accompanied by one or more Tm at a higher temperature during the denaturation. e–g Overview of NanoDSF. e Intrinsic fluorescence of tryptophan is measured at both 330- and 350-nm wavelengths and plotted versus temperature from 20 to 60 °C during unfolding. f F330/350 fluorescence ratio intensity of tryptophan plotted against temperature. g The melting temperature is calculated by the first derivative of the F330/350 plots, with the sample given here showing a Tm of 48 °C. All the figures above represent thermal unfolding curves of the menin protein and are obtained from DSF experiments conducted in our lab. The experiments were performed by using either the Bio-Rad CFX96 Real-Time PCR system or the NanoTemper Prometheus NT.48 system. Curves were plotted from the fluorescence data using Excel

