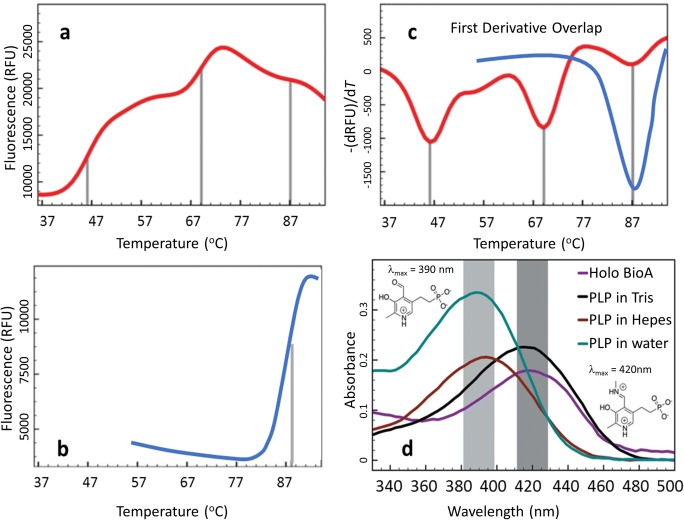
Fig. 6.
a DSF melting curves of BioA with PLP and Tris in both lysis and storage buffer, which shows multiple peaks during denaturing. b A sharp DSF melting curve of BioA with subsaturation of PLP; misfolded and apo peaks were eliminated after BioA was saturated with PLP, resulting in enhanced stability of BioA, with a Tm at 88 °C. c First derivative overlap of the corresponding melting curves. The red line indicates BioA in Tris buffer, with multiple transitions at 45, 68, and 86 °C, representing the misfolded, apo, PLP-bound BioA, respectively. The blue line represents BioA saturated with PLP for which the Tm was enhanced dramatically to 88 °C. d UV-Vis spectroscopy of PLP or PLP-BioA(holo) at various conditions; 400 μM PLP in water (cyan) has the same absorbance as in Hepes buffer (brown); PLP-bound BioA(holo) (purple) showed the same absorbance close to 420 nm as PLP in Tris buffer (black). The figures are adapted from Geders et al. (2012). Reproduced with permission of the International Union of Crystallography

