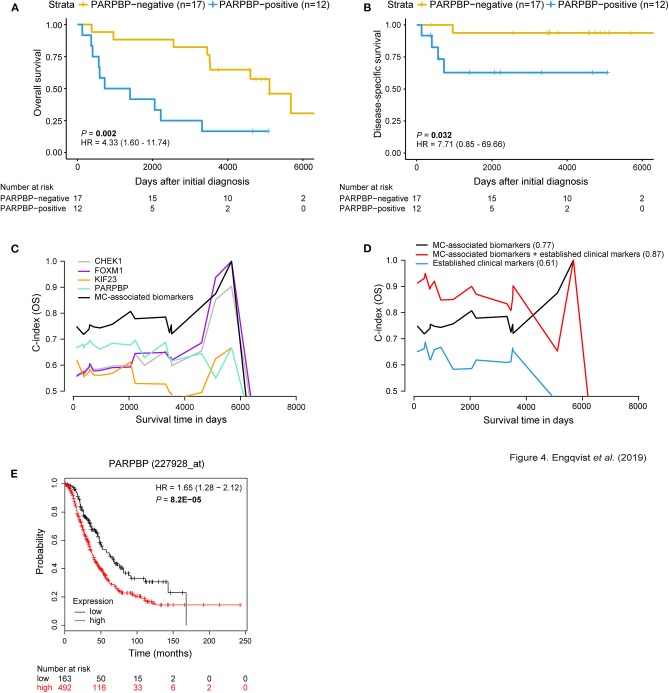
Figure 4.
MC-associated biomarkers related to prognosis. Kaplan-Meier survival plots for OS/DSS illustrating dichotomized PARPBP protein expression. Positive PARPBP protein expression correlated with shorter OS and DSS [P-value = 0.002, HR = 4.33 (95% CI 1.60–11.74); P-value = 0.032, HR = 7.71 (95% CI 0.85–69.66)]. The x-axis depict days after initial diagnosis and the y-axis survival outcome (OS/DSS). The number of patients at risk by time (days after initial diagnosis) is shown below the Kaplan-Meier plot (A,B). Univariable and multivariable survival plots depicting predictive potential [AUC(t) plots] of individual MC-associated biomarkers and improved predictive power when in combination (black curve) for OS (C). Multivariable survival analysis showing improved predictive performance when adding protein expression status of the MC-associated biomarkers to the established clinical markers (age, stage, CA125, ploidy) for OS (C-index = 0.87) (D). C-index values for respective curve is shown in parentheses. The x-axis depict survival time in days and the y-axis C-index values (OS/DSS). External validation using KM plotter for ovarian carcinoma patients was used to test the prognostic value of the biomarkers associated with MC. Here, the prognostic value of PARPBP is validated wherein PARPBP-positive gene expression (red curve) corresponds with shorter OS (n = 655 HGSC and EC patients) (E). The number of patients at risk by (days after initial diagnosis) is indicated below the Kaplan-Meier plot. Cox proportional hazard models and log-rank tests were used to calculate HR, 95% confidence interval, and log rank P-value.

