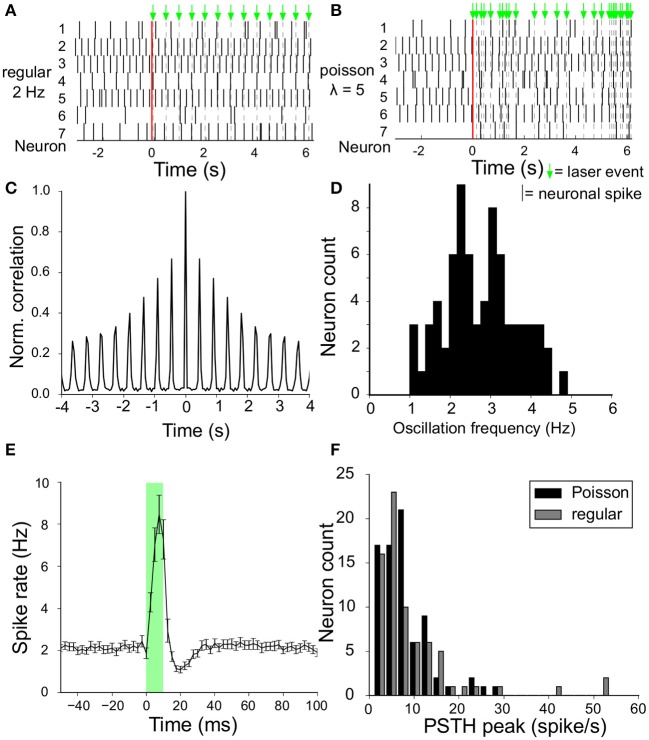
Figure 3.
Spontaneous activity and modulation by laser stimuli. (A) Raster plot of simultaneously recorded spike activity of a sample of seven VTA dopamine neurons in the same slice, before and during laser stimulation (onset at t = 0, vertical red line). Laser stimuli were delivered at a frequency of (2Hz), and are depicted by the green arrows above the top panel. (B) Same as (A) but now with laser pulses with a Poisson interval distribution (having an expectation value of 5 events/s). (C) Auto-correlation of the spontaneous activity of an example VTA dopamine neuron. The oscillation frequency was derived from the side-lobes in the auto-correlation. (D) Distribution of oscillation frequencies of all recorded VTA dopamine neurons (n = 73) from 7 experiments (=slices/animals). (E) Instantaneous firing rate around the laser stimulus, calculated from the Peri-Stimulus-Time-Histogram (2.5ms bin size) accumulated from all neurons (n = 73) for the 2Hz regular stimulation protocol. A sharp peak is followed by a trough in the spike rate during and after the laser stimulus given at (t = 0, transparent green) with stimulus duration of 10ms). (F) The maximum increase in instantaneous firing rate (peak minus baseline value) of the curve in (E) for all neurons is aggregated into a histogram to show the distribution of laser stimulation efficacy (n = 73). Results shown for both regular (gray) and Poisson stimulation (black).

