Figure 5.

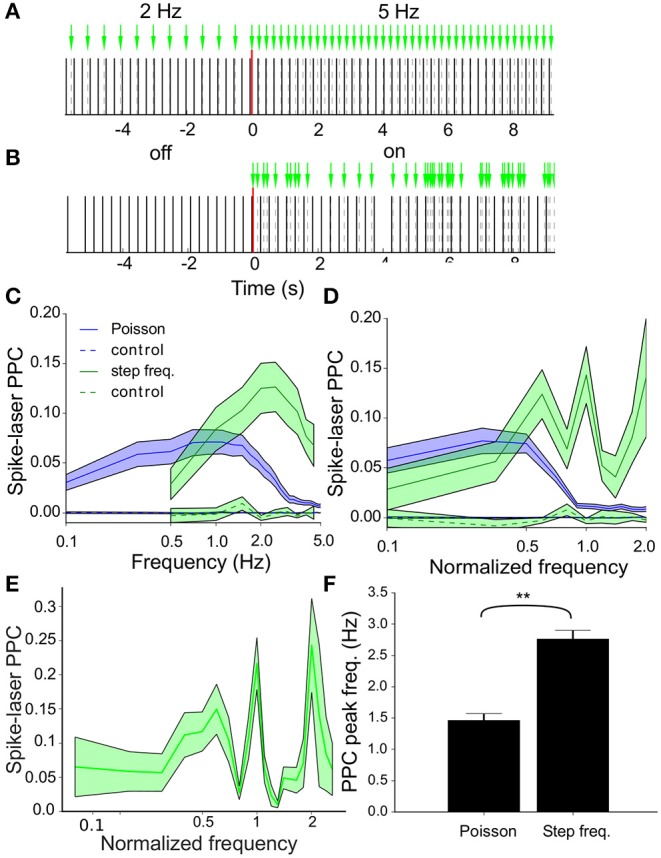
Resonance of the VTA dopamine neuron population. (A) Step frequency protocol with frequency transition between two 30s recording periods transitioning from 2Hz to 5Hz stimulation. In addition to the actual protocol a control analysis was performed on an emulated (surrogate) stimulation protocol applied to baseline recordings of the neurons. (B) Laser stimulation as a Poisson process with 5 events/s (λ = 5) with laser-off and laser-on periods interleaved. (C) Pairwise phase consistency (PPC) spectra averaged across all neurons (n = 73) during stimulation [regular (green) and Poisson (blue), (mean ± sem)] measuring the phase synchronization between neuronal spikes and laser pulses. During regular stimulation a peak in resonance between neurons and laser was seen around 2Hz, whereas the highest resonance was observed around 1Hz during Poisson stimulation. The controls (dashed lines in the same color scheme) show that the correlation was not due to biasing factors such as incidental synchrony between laser and neuron. (D) PPC spectra averaged across all neurons (n = 73) during stimulation [regular (green) and Poisson (blue), (mean ± sem)]. Before averaging, the frequency values (x-axis) were normalized by dividing by the oscillation frequency for each individual neuron. During regular stimulation, we observed speaks in resonance around the oscillation frequency (corresponding to frequency value of 1.0) and its harmonics. Poisson stimulation led to resonance at relatively lower frequencies as compared to stimulation with regular pulse trains. (E) Same as (D) but now at a higher resolution, only for regular stimulation. (F) Bar plots of the peak spike-laser PPC frequency. The peak resonance-frequency is higher during step frequency (i.e., regular) stimulation as compared to Poisson stimulation. By contrast, the oscillation frequency (not shown) did not change between protocols.
