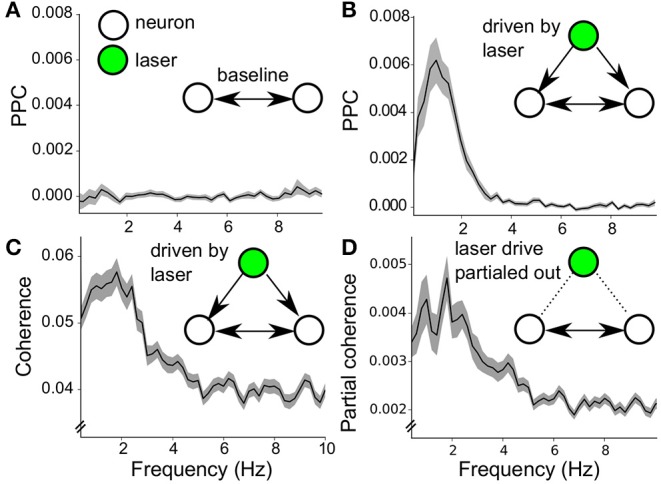
Figure 8.

Noise induced synchrony during Poisson stimulation. (A) Baseline PPC spectrum (stimulation off) of pairwise neuron-neuron interactions (neuron pairs = 347) within the 7 recorded populations (mean ± sem). (B) Same calculation as in (A) during laser stimulation (mean ± sem). The peak around 1Hz indicates synchrony among pairs of VTA dopamine neurons (neuron pairs = 347). (C) Coherence spectrum of neuron-neuron interactions during stimulation on (mean ± sem, neuron pairs = 347), confirming the results in (B). (D) Partial coherence spectrum (mind the y-axis, mean ± sem, neuron pairs = 347). Around 10% of the coherence in (C) is not directly related to the common drive, as it is taken into account during the coherence computation.
