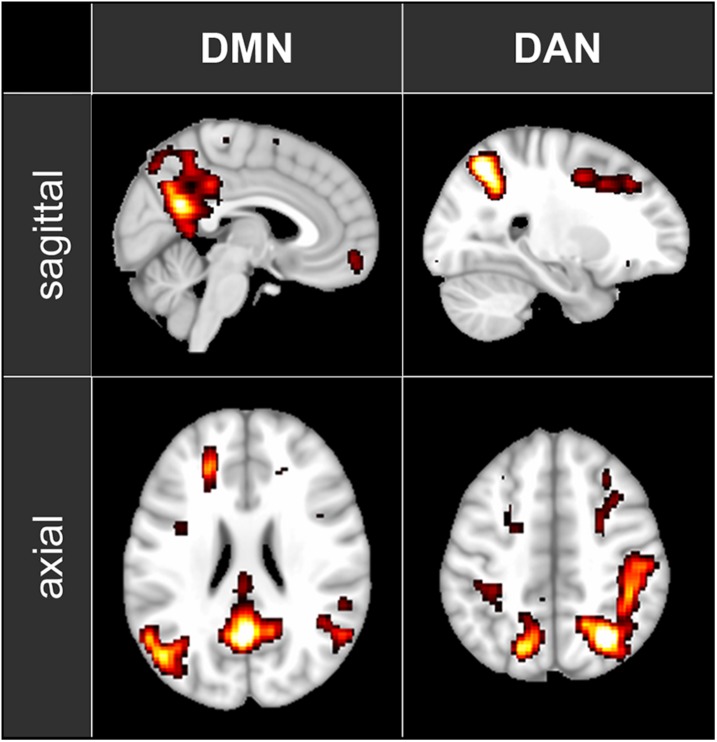
FIGURE 1.
The maps of the two ICA components representing DMN and DAN that have been used in the functional connectivity analysis. The maps are shown in axial and sagittal views superimposed on a standard MNI152 T1 2 mm resolution brain template. The following areas are visible: DMN: posterior cingulate cortex (with the adjacent regions of the precuneus), left and right inferior parietal lobule and medial prefrontal cortex; DAN: left and right intraparietal sulcus, left and right frontal eye field.

