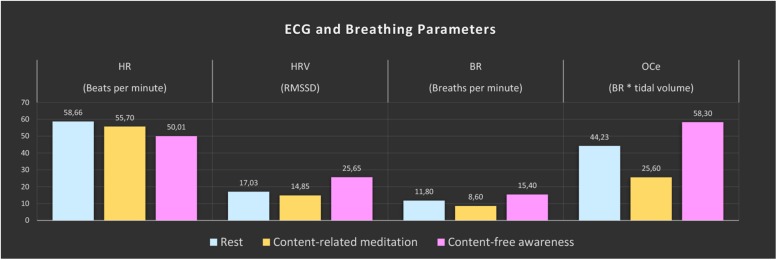
FIGURE 2.
ECG and breathing measures. The color bars represent the median values of the 5-min epochs of rest (blue), content-related meditation (yellow) and content-free awareness (pink) in each case. From left to right: heart rate (HR), heart-rate variability (HRV, RMSSD = root mean square of successive differences), breathing rate (BR), estimated oxygen consumption (OCe).

