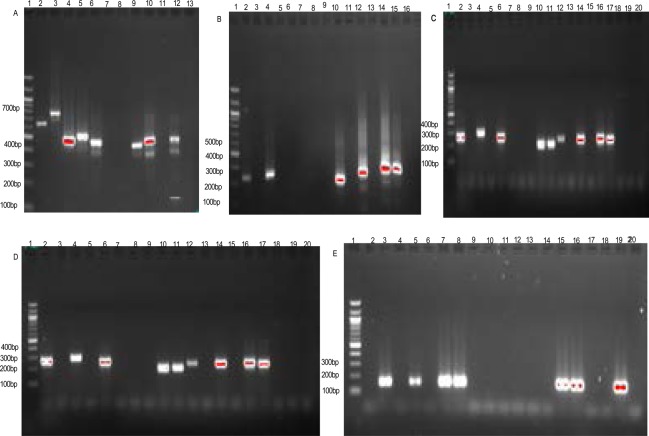
Fig 2.
Banding pattern of msp1 and msp2 alleles of P. falciparum.
A = IC3D7; Lane 1, 100 bp DNA ladder; Lanes, 2–9, selected samples; Lane 10–12, Positives controls (10,IC3D7; 11,Dd2; 12,HB3); Lane13, negative control.
B = FC27; Lane 1, 100 bp DNA ladder; Lane 10–12, selected samples; Lane,13–15, Positives controls (13, IC3D7; 14, Dd2; 15,HB3); Lane 16, negative control.
C = K1, D = MAD20, E = RO33; Lane 1, 100 bp DNA ladder; Lanes, 2–16, selected samples; Lane 17–19, Positives controls (17,IC3D7; 18,Dd2;19,HB3); Lane 20, negative control.

