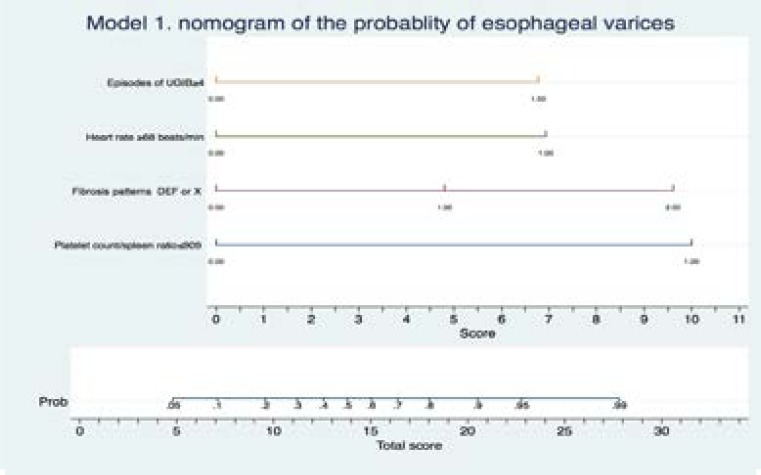
Figure 2.
A nomogram of model 1 consisting of platelet count spleen diameter ratio ≤909, WHO peri-portal fibrosis patterns EF or X, number lifetime of episodes of UGIB≥4, heart rate ≥68beats/minute. This enables one to calculate output probabilities for predictive models with a visual approach. Estimate the probability of having varices through 3 steps. Step 1 -establish scores for all variable values, step 2-obtain the total score adding up all the scores obtained in the previous step, step 3-obtain the probability of the event (total Score -> Probability of event).

