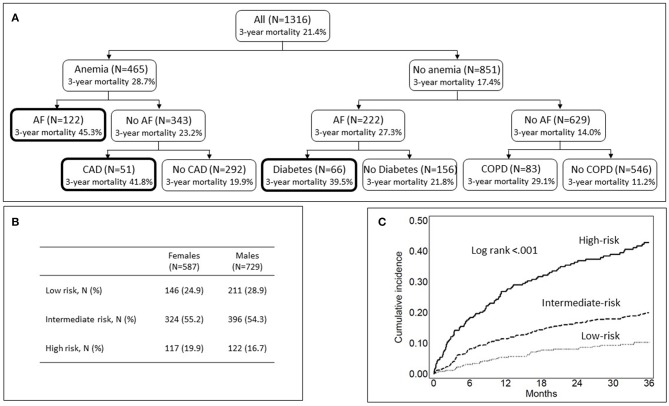
Figure 3.
Classification of patients into risk-of-death categories based on comorbidity. (A) Shows the results of recursive partitioning analysis. Bold lines denote the high-risk category. (B) Shows the distribution of females and males across the three risk categories. (C) Shows Kaplan Meier mortality curves for the high-, intermediate-, and low-risk categories.

