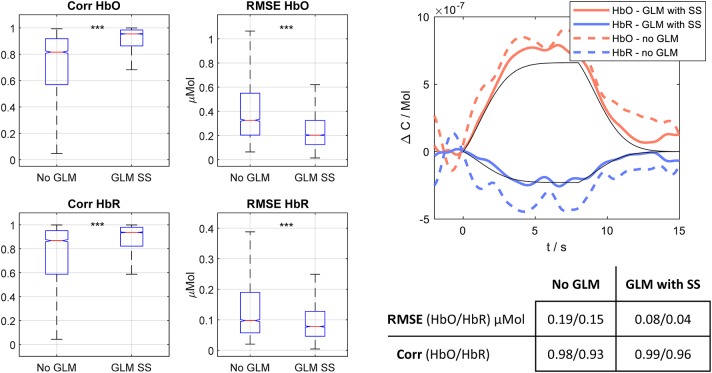
Figure 7.
(Left) Correlation and RMSE boxplots for extracted single trial HRFs with both methodological approaches. Red line: median. Bottom/top box edges: 25th/75th percentile. Whiskers extend to most extreme data points that are not outliers. Significance for paired t-test ***p << 10−3. (Right) Exemplary HRF recovered with both approaches. HbO/HbR (coral/blue) estimated via GLM with SS (solid) and no-GLM (dashed). Table provides the RMSE and Corr values for GLM with SS and no-GLM for the depicted HRFs.

