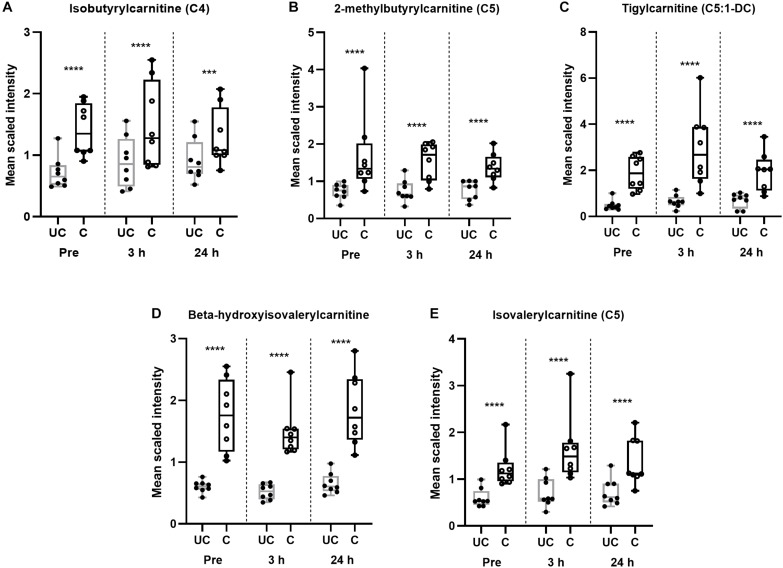
FIGURE 3.
Training alters BCAA catabolism regardless of time point. (A–E) Box and whisker plots of BCAA-derived acylcarnitines in unconditioned (UC) and conditioned (C) skeletal muscle samples. Data are represented from minimum to maximum and show each individual point. The middle line of the box plot represents the mean. ∗∗∗p < 0.005, ****p < 0.0005, significant difference from UC, according to one-way ANOVA. n = 8 per group.

