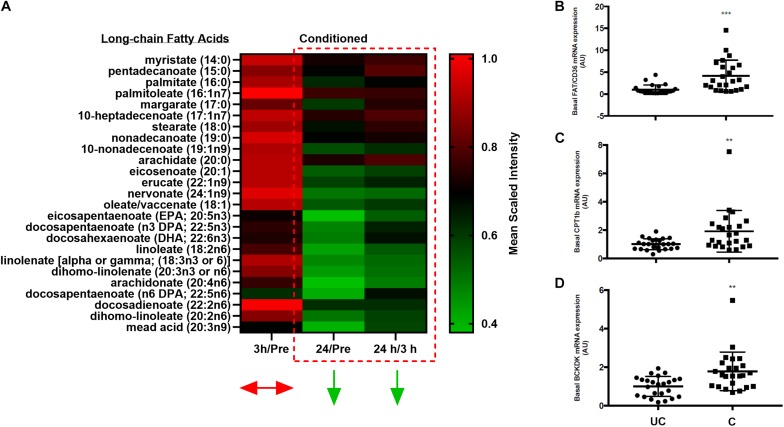
FIGURE 5.
Changes in skeletal muscle free-fatty acid abundance and gene expression. (A) Heatmap depicting changes in the relative abundances of free-fatty acids over time in conditioned skeletal muscle. Color scale reflects mean scaled intensities. (B–D) Scatter plots (mean ± SD) of all pre-exercise and standing control skeletal muscle basal mRNA expression levels (pooled) of FAT/CD36 (B), CPT1B (C), and BCKDK (D) in unconditioned (UC) and conditioned (C) horses. n = 24 UC, n = 24 C. **p = 0.005, ***p = 0.0005, significant difference from UC, according to paired t-test.

