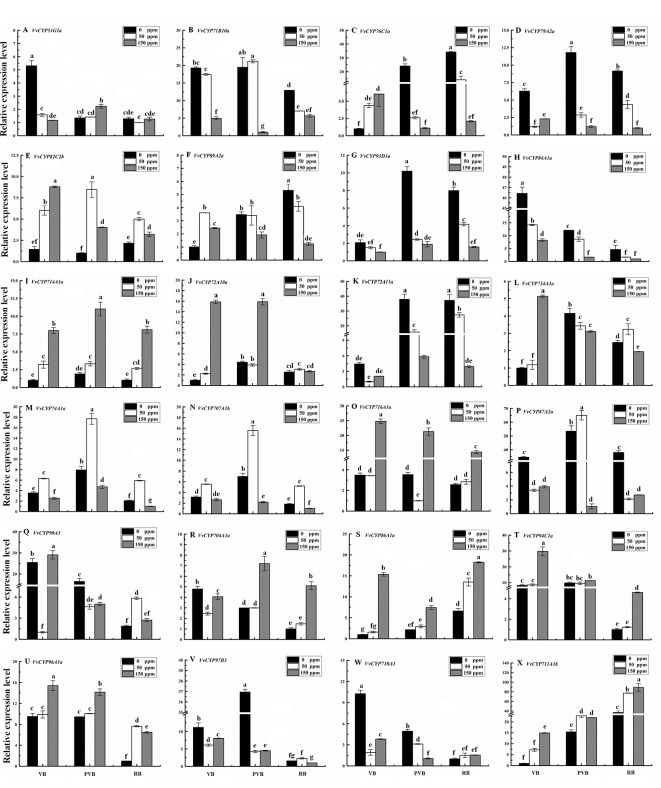
Figure 10.
Relative expression levels of VvCYPs under ABA treatment. Values were normalized against the expression data of KyActin1 and are given as means ± standard deviation among three biological replicates. Different letters indicate significant differences between genes (p< 0.05). The expression levels were calculated based on the 2 −△△Ct method. The expression levels of VvCYP51G1a (A), VvCYP71B10a (B), VvCYP76C1a (C), VvCYP79A2a (D), VvCYP82C2b (E), VvCYP89A2a (F), VvCYP93D1a (G), VvCYP84A1a (H), VvCYP714A1a (I), VvCYP72A10a (J), VvCYP72A11a (K), VvCYP734A1a (L), VvCYP74A1a (M), VvCYP707A1b (N), VvCYP716A1a (O), VvCYP87A2a (P), VvCYP90A1 (Q), VvCYP704A1a (R), VvCYP86A1a (S), VvCYP94C1a (T), VvCYP96A1a (U), VvCYP97B3 (V), VvCYP710A1 (W), and VvCYP711A1b (X) under ABA treatment.

