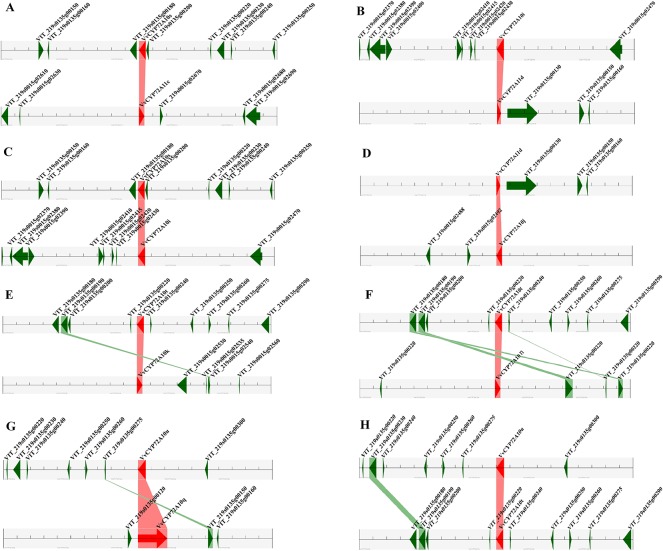
Figure 6.
Segmental duplication between members of the VvCYPs subfamily. (A) VvCYP72A10s (VIT_219s0135g00190.1) and VvCYP72A11c (VIT_219s0015g02660.1), (B) VvCYP72A10i (VIT_219s0015g02440.2) and VvCYP72A11d (VIT_219s0135g00120.1), (C) VvCYP72A10s (VIT_219s0135g00190.1) and VvCYP72A10i (VIT_219s0015g02440.2), (D) VvCYP72A11d (VIT_219s0135g00120.1) and VvCYP72A10j (VIT_219s0015g02500.1), (E) VvCYP72A10t (VIT_219s0135g00230.1) and VvCYP72A10k (VIT_219s0015g02520.1), (F) VvCYP72A10t (VIT_219s0135g00230.1) and VvCYP72A10n (VIT_219s0015g02900.1), (G) VvCYP72A10u (VIT_219s0135g00290.1) and VvCYP72A10q (VIT_219s0135g00130.1), (H) VvCYP72A10u (VIT_219s0135g00290.1) and VvCYP72A10t (VIT_219s0135g00230.1). The figure shows a region of 100 kb on each side flanking the VvCYP genes. Homologous gene pairs are connected with bands. Chromosome segments are indicated by black horizontal lines, and a grey line with arrowhead represents a gene. The VvCYP genes are shown in red, and homologous genes are linked by the pink line, other genes are shown in green, and homologous genes are linked by the green line.

