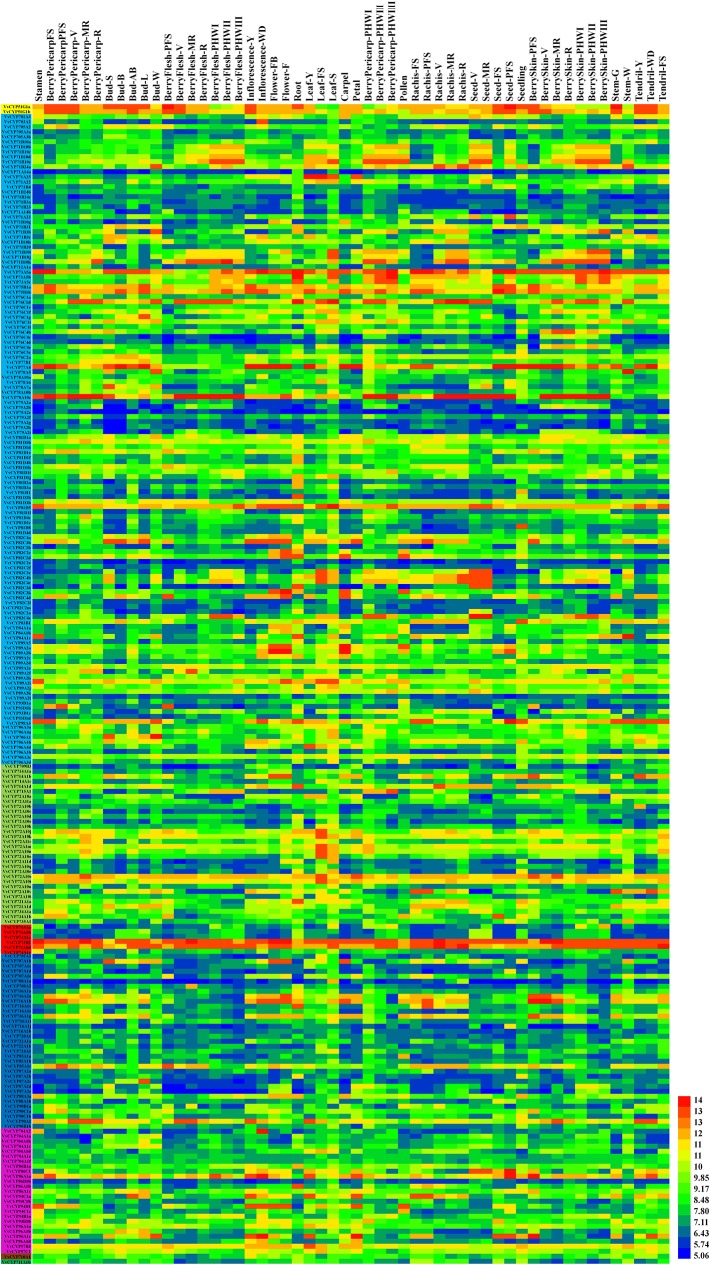
Figure 7.
Expression profiles of VvCYP genes in the V. vinifera cv “Corvina” atlas (GEO Accession: GSE36128). Data were normalized based on the mean expression value of each gene in all tissues (Fasoli et al., 2012). The mean expression values were again normalized using logarithm with the base of 2 using the Heml software. Blue and red boxes show low and high expression levels, respectively, for each gene.

