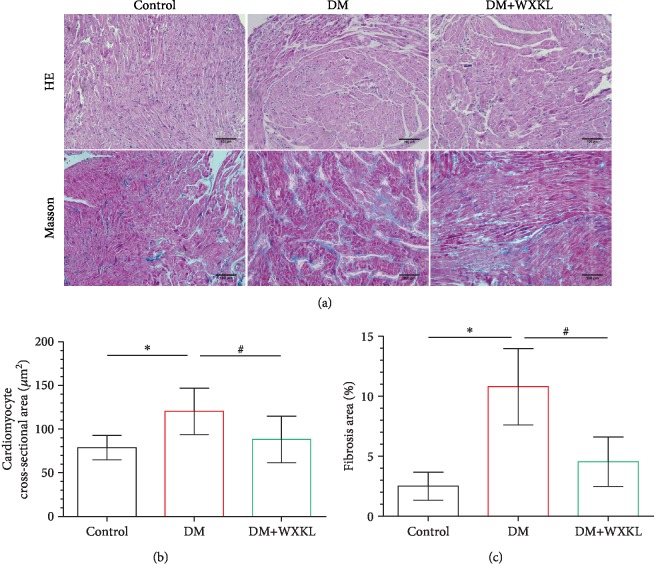
Figure 4.
WXKL improves the atrial modeling in diabetic rats. (a) Representative images of right atrial HE and Masson's trichrome staining (200x). (b) Cardiomyocyte cross-sectional area and (c) interstitial fibrosis. Values are presented as mean ± SD. ∗Compared with the control group, P < 0.05. #Compared with the DM group, P < 0.05; n = 8 per group.

