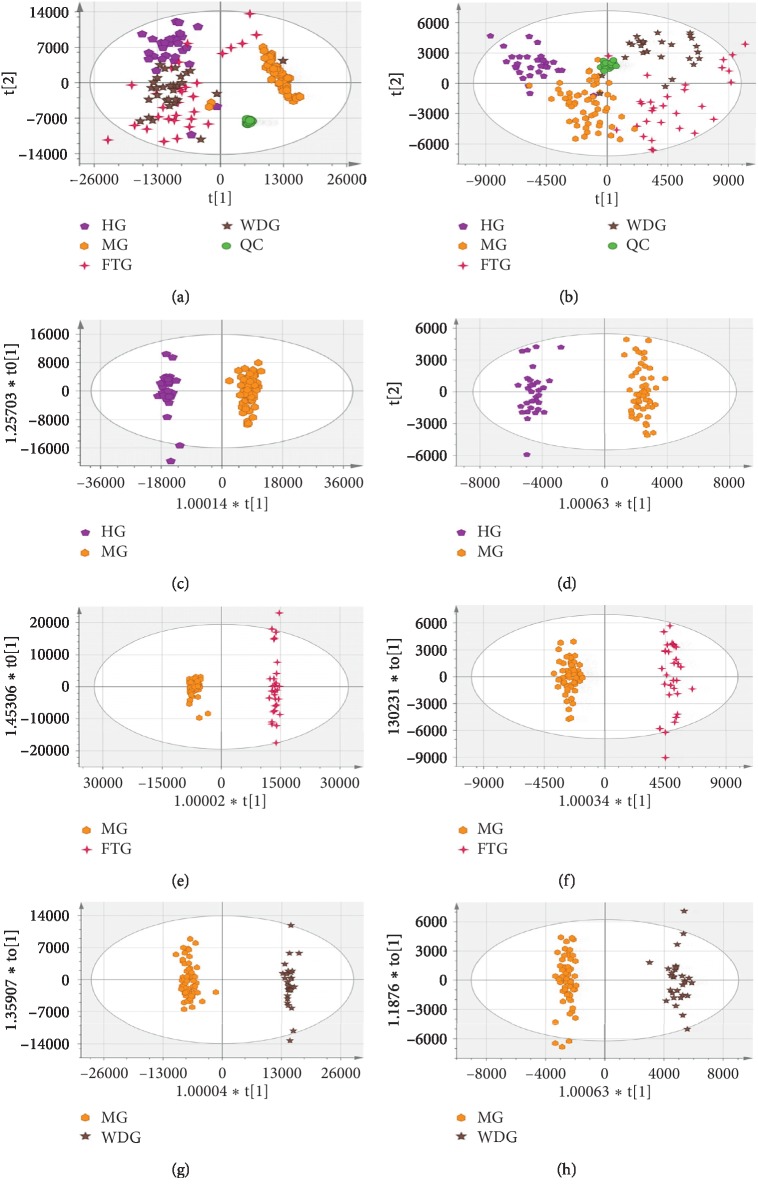
Figure 3.
PCA and OPLS-DA score plots in the positive mode and the negative mode. PCA score plot of each group in the positive mode (a) and the negative mode (b). OPLS-DA score plots from MG vs HG in the positive mode (c) and the negative mode (d); FTG vs MG in the positive mode (e) and the negative mode (f); and WDG vs MG in the positive mode (g) and the negative mode (h). The model parameters were (a) R2X = 0.836, Q2 = 0.606; (b) R2X = 0.884, Q2 = 0.671; (c) R2X = 0.615, R2Y = 0.983, Q2 = 0.968; (d) R2X = 0.754, R2Y = 0.942, Q2 = 0.840; (e) R2X = 0.677, R2Y = 0.992, Q2 = 0.963; (f) R2X = 0.664, R2Y = 0.930, Q2 = 0.788; (g) R2X = 0.691, R2Y = 0.988, Q2 = 0.958; and (h) R2X = 0.725, R2Y = 0.914, Q2 = 0.870.

