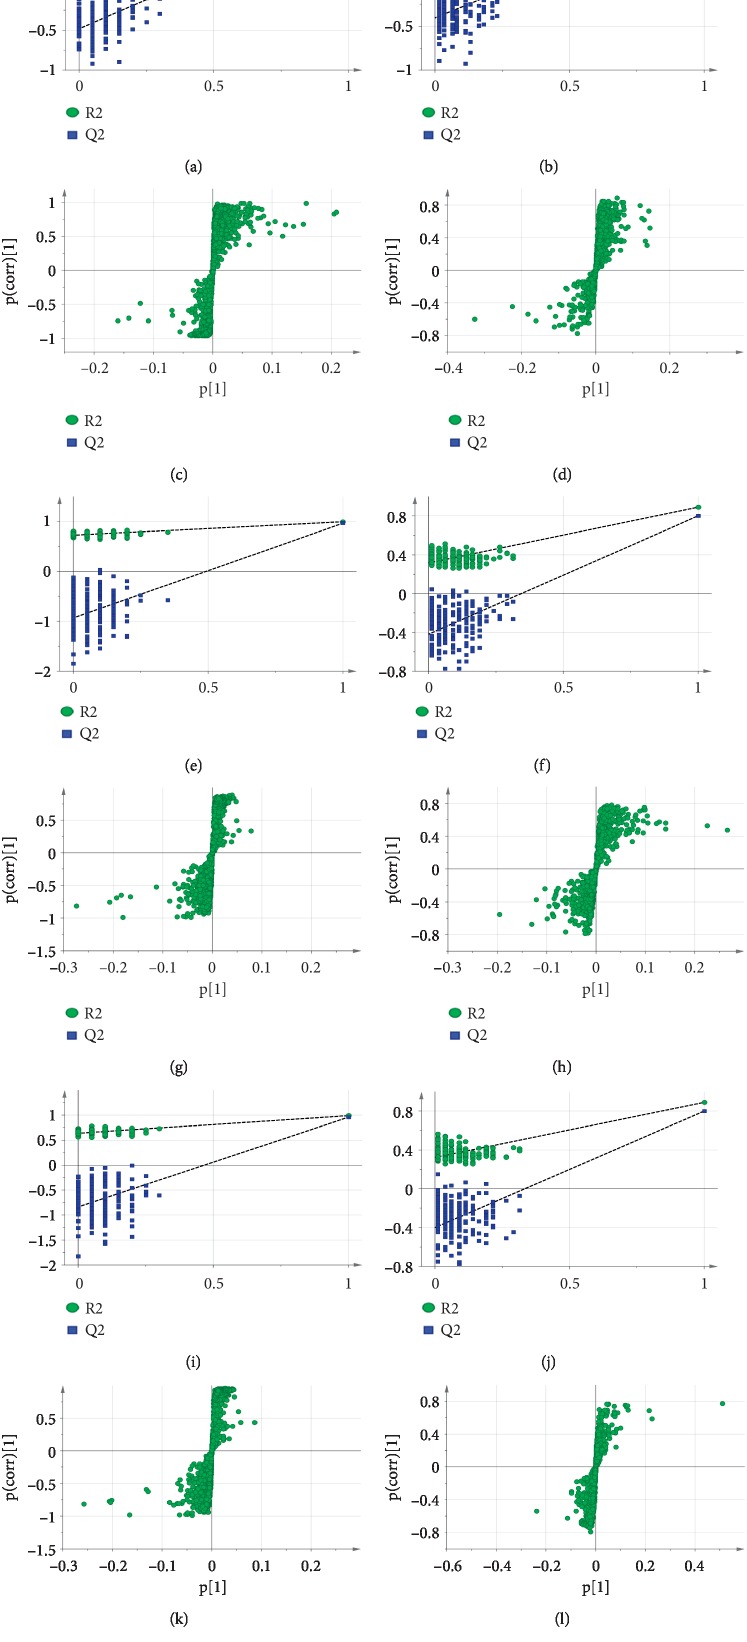
Figure 4.
Validation of the OPLS-DA model by permutation tests with 200 times and generated S-plot. 200-time permutations were performed and plotted and compared MG vs HG in (a) positive ion and (b) negative ion, FTG vs MG in (e) positive ion and (f) negative ion, and WDG vs MG in (i) positive ion and (j) negative ion. The yielded intercept values of (a) R2 = 0.358, Q2 = –0.481; (b) R2 = 0.493, Q2 = –0.536; (e) R2 = 0.726, Q2 = –0.932; (f) R2 = 0.478, Q2 = –0.593; (i) R2 = 0.639, Q2 = –0.838; and (j) R2 = 0.314, Q2 = –0.393. OPLS-DA S-plot for serum metabolites compared MG vs HG in (c) positive ion and (d) negative ion, FTG vs MG in (g) positive ion and (h) negative ion, and WDG vs MG in (k) positive ion and (l) negative ion.

