Figure 6.

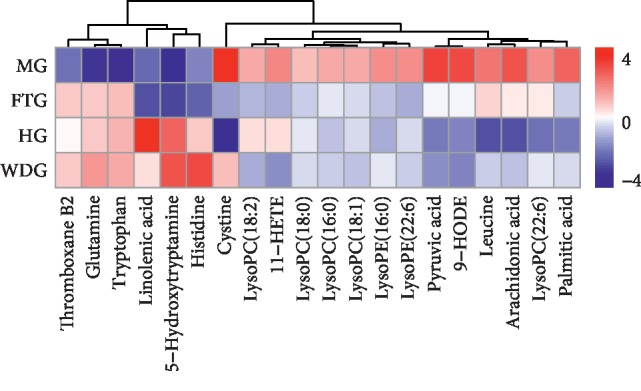
Heatmap analysis of the 20 identified metabolites between HG, MG, FTG, and WDG. The relative content of the compound is shown by color depth, the higher content is represented in red, and the lower content is represented in blue.

Heatmap analysis of the 20 identified metabolites between HG, MG, FTG, and WDG. The relative content of the compound is shown by color depth, the higher content is represented in red, and the lower content is represented in blue.